Immigrants from China vs Barbadian 8th Grade
COMPARE
Immigrants from China
Barbadian
8th Grade
8th Grade Comparison
Immigrants from China
Barbadians
95.0%
8TH GRADE
1.1/ 100
METRIC RATING
249th/ 347
METRIC RANK
94.6%
8TH GRADE
0.1/ 100
METRIC RATING
280th/ 347
METRIC RANK
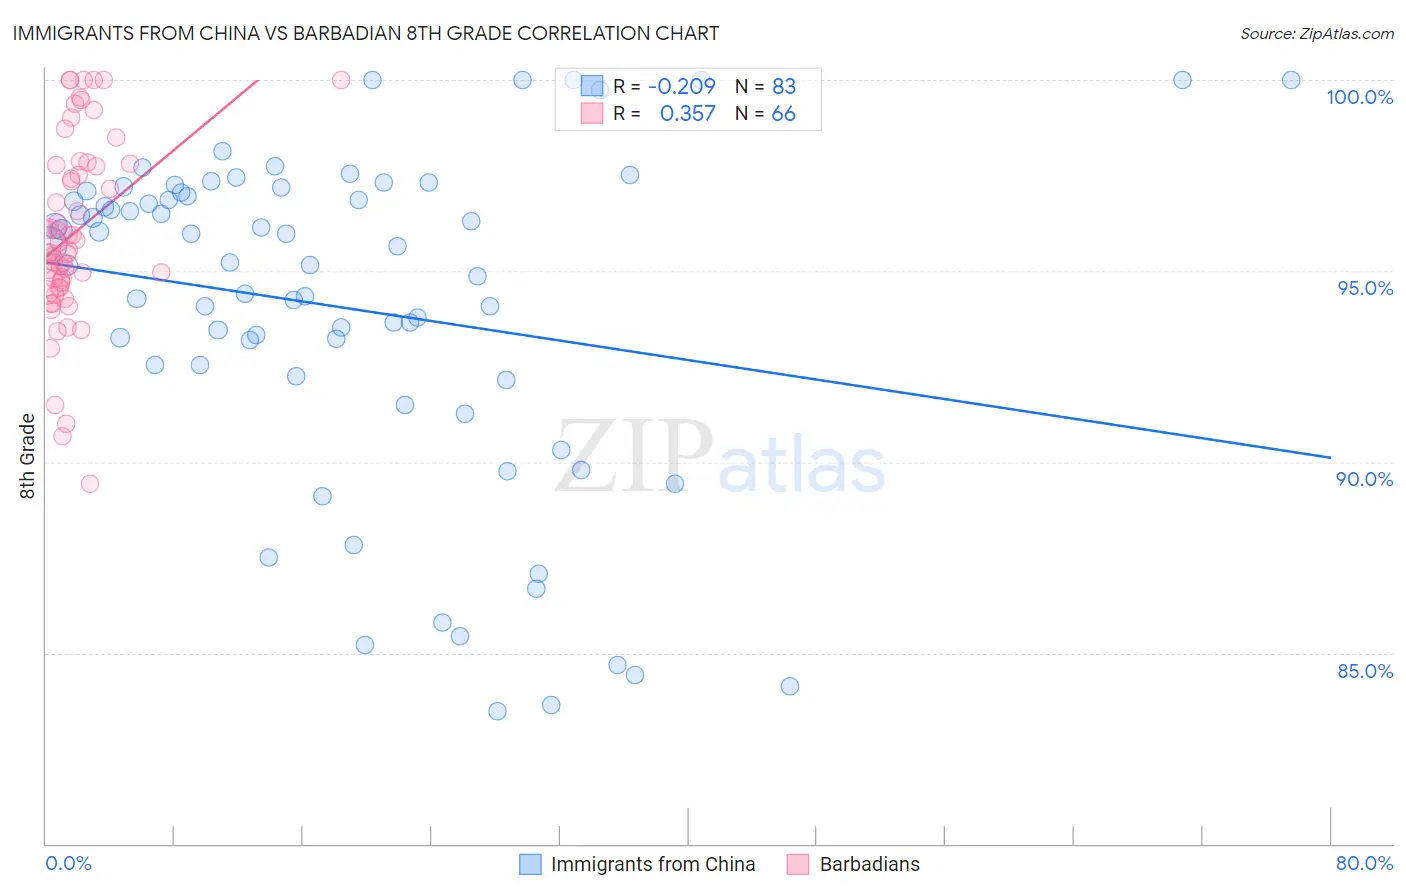
Immigrants from China vs Barbadian 8th Grade Correlation Chart
The statistical analysis conducted on geographies consisting of 457,082,957 people shows a weak negative correlation between the proportion of Immigrants from China and percentage of population with at least 8th grade education in the United States with a correlation coefficient (R) of -0.209 and weighted average of 95.0%. Similarly, the statistical analysis conducted on geographies consisting of 141,299,217 people shows a mild positive correlation between the proportion of Barbadians and percentage of population with at least 8th grade education in the United States with a correlation coefficient (R) of 0.357 and weighted average of 94.6%, a difference of 0.42%.
8th Grade Correlation Summary
| Measurement | Immigrants from China | Barbadian |
| Minimum | 83.5% | 89.4% |
| Maximum | 100.0% | 100.0% |
| Range | 16.5% | 10.6% |
| Mean | 94.0% | 96.0% |
| Median | 95.2% | 95.5% |
| Interquartile 25% (IQ1) | 92.3% | 94.6% |
| Interquartile 75% (IQ3) | 97.0% | 97.8% |
| Interquartile Range (IQR) | 4.8% | 3.2% |
| Standard Deviation (Sample) | 4.4% | 2.4% |
| Standard Deviation (Population) | 4.3% | 2.4% |
Similar Demographics by 8th Grade
Demographics Similar to Immigrants from China by 8th Grade
In terms of 8th grade, the demographic groups most similar to Immigrants from China are Korean (95.0%, a difference of 0.0%), Bolivian (95.0%, a difference of 0.010%), Uruguayan (95.1%, a difference of 0.020%), Immigrants from Ethiopia (95.0%, a difference of 0.020%), and U.S. Virgin Islander (95.0%, a difference of 0.030%).
| Demographics | Rating | Rank | 8th Grade |
| Tongans | 1.7 /100 | #242 | Tragic 95.1% |
| Paiute | 1.7 /100 | #243 | Tragic 95.1% |
| Immigrants | Middle Africa | 1.7 /100 | #244 | Tragic 95.1% |
| Jamaicans | 1.4 /100 | #245 | Tragic 95.1% |
| Somalis | 1.4 /100 | #246 | Tragic 95.1% |
| Immigrants | Senegal | 1.4 /100 | #247 | Tragic 95.1% |
| Uruguayans | 1.2 /100 | #248 | Tragic 95.1% |
| Immigrants | China | 1.1 /100 | #249 | Tragic 95.0% |
| Koreans | 1.1 /100 | #250 | Tragic 95.0% |
| Bolivians | 1.0 /100 | #251 | Tragic 95.0% |
| Immigrants | Ethiopia | 1.0 /100 | #252 | Tragic 95.0% |
| U.S. Virgin Islanders | 0.9 /100 | #253 | Tragic 95.0% |
| Immigrants | Cameroon | 0.8 /100 | #254 | Tragic 95.0% |
| Immigrants | Somalia | 0.7 /100 | #255 | Tragic 95.0% |
| Colombians | 0.7 /100 | #256 | Tragic 95.0% |
Demographics Similar to Barbadians by 8th Grade
In terms of 8th grade, the demographic groups most similar to Barbadians are Immigrants from Trinidad and Tobago (94.6%, a difference of 0.0%), Immigrants from Bolivia (94.6%, a difference of 0.0%), Armenian (94.7%, a difference of 0.010%), Taiwanese (94.7%, a difference of 0.040%), and Immigrants from Eritrea (94.6%, a difference of 0.040%).
| Demographics | Rating | Rank | 8th Grade |
| Immigrants | Western Africa | 0.2 /100 | #273 | Tragic 94.8% |
| Trinidadians and Tobagonians | 0.2 /100 | #274 | Tragic 94.7% |
| Immigrants | Colombia | 0.2 /100 | #275 | Tragic 94.7% |
| Peruvians | 0.1 /100 | #276 | Tragic 94.7% |
| Taiwanese | 0.1 /100 | #277 | Tragic 94.7% |
| Armenians | 0.1 /100 | #278 | Tragic 94.7% |
| Immigrants | Trinidad and Tobago | 0.1 /100 | #279 | Tragic 94.6% |
| Barbadians | 0.1 /100 | #280 | Tragic 94.6% |
| Immigrants | Bolivia | 0.1 /100 | #281 | Tragic 94.6% |
| Immigrants | Eritrea | 0.1 /100 | #282 | Tragic 94.6% |
| Immigrants | St. Vincent and the Grenadines | 0.1 /100 | #283 | Tragic 94.6% |
| Immigrants | Philippines | 0.1 /100 | #284 | Tragic 94.6% |
| Immigrants | Barbados | 0.0 /100 | #285 | Tragic 94.5% |
| Immigrants | Peru | 0.0 /100 | #286 | Tragic 94.5% |
| Tohono O'odham | 0.0 /100 | #287 | Tragic 94.5% |