Soviet Union vs Immigrants from Senegal In Labor Force | Age 25-29
COMPARE
Soviet Union
Immigrants from Senegal
In Labor Force | Age 25-29
In Labor Force | Age 25-29 Comparison
Soviet Union
Immigrants from Senegal
85.3%
IN LABOR FORCE | AGE 25-29
98.5/ 100
METRIC RATING
74th/ 347
METRIC RANK
84.8%
IN LABOR FORCE | AGE 25-29
68.3/ 100
METRIC RATING
145th/ 347
METRIC RANK
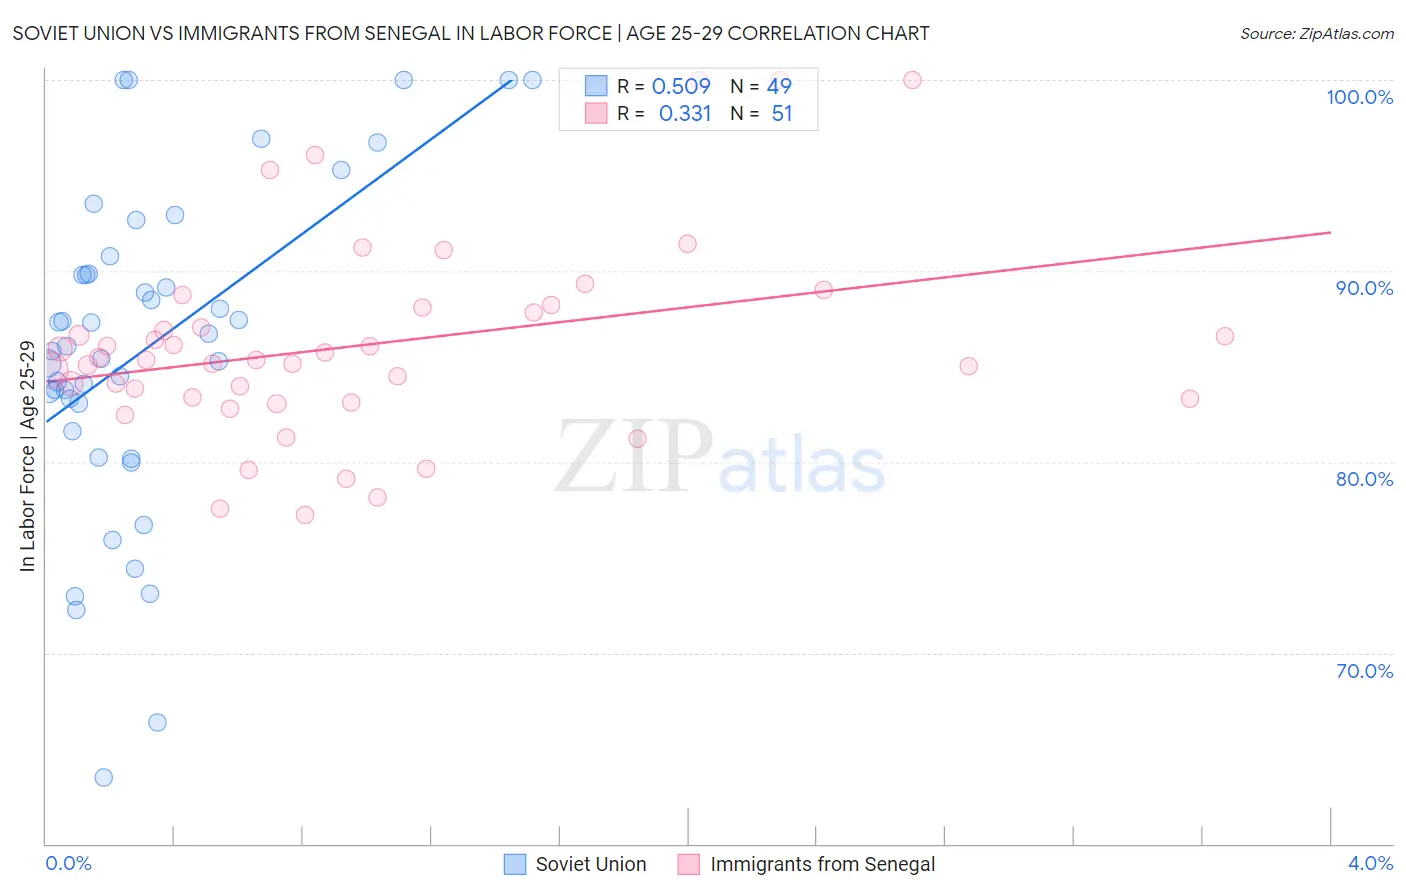
Soviet Union vs Immigrants from Senegal In Labor Force | Age 25-29 Correlation Chart
The statistical analysis conducted on geographies consisting of 43,504,224 people shows a substantial positive correlation between the proportion of Soviet Union and labor force participation rate among population between the ages 25 and 29 in the United States with a correlation coefficient (R) of 0.509 and weighted average of 85.3%. Similarly, the statistical analysis conducted on geographies consisting of 90,123,722 people shows a mild positive correlation between the proportion of Immigrants from Senegal and labor force participation rate among population between the ages 25 and 29 in the United States with a correlation coefficient (R) of 0.331 and weighted average of 84.8%, a difference of 0.63%.
In Labor Force | Age 25-29 Correlation Summary
| Measurement | Soviet Union | Immigrants from Senegal |
| Minimum | 63.5% | 77.2% |
| Maximum | 100.0% | 100.0% |
| Range | 36.5% | 22.8% |
| Mean | 86.0% | 86.1% |
| Median | 86.1% | 85.4% |
| Interquartile 25% (IQ1) | 82.3% | 83.3% |
| Interquartile 75% (IQ3) | 90.3% | 88.1% |
| Interquartile Range (IQR) | 8.0% | 4.8% |
| Standard Deviation (Sample) | 8.5% | 5.2% |
| Standard Deviation (Population) | 8.4% | 5.2% |
Similar Demographics by In Labor Force | Age 25-29
Demographics Similar to Soviet Union by In Labor Force | Age 25-29
In terms of in labor force | age 25-29, the demographic groups most similar to Soviet Union are Brazilian (85.3%, a difference of 0.030%), Russian (85.3%, a difference of 0.040%), Immigrants from Australia (85.3%, a difference of 0.050%), German (85.3%, a difference of 0.050%), and Kenyan (85.4%, a difference of 0.070%).
| Demographics | Rating | Rank | In Labor Force | Age 25-29 |
| Immigrants | Turkey | 99.2 /100 | #67 | Exceptional 85.4% |
| Immigrants | Cameroon | 99.2 /100 | #68 | Exceptional 85.4% |
| Menominee | 99.1 /100 | #69 | Exceptional 85.4% |
| Immigrants | Sweden | 99.1 /100 | #70 | Exceptional 85.4% |
| Kenyans | 99.0 /100 | #71 | Exceptional 85.4% |
| Immigrants | Australia | 98.9 /100 | #72 | Exceptional 85.3% |
| Russians | 98.8 /100 | #73 | Exceptional 85.3% |
| Soviet Union | 98.5 /100 | #74 | Exceptional 85.3% |
| Brazilians | 98.3 /100 | #75 | Exceptional 85.3% |
| Germans | 98.1 /100 | #76 | Exceptional 85.3% |
| Immigrants | South Central Asia | 97.9 /100 | #77 | Exceptional 85.2% |
| Immigrants | Egypt | 97.7 /100 | #78 | Exceptional 85.2% |
| Immigrants | Northern Africa | 97.6 /100 | #79 | Exceptional 85.2% |
| Immigrants | Zimbabwe | 97.6 /100 | #80 | Exceptional 85.2% |
| Immigrants | Northern Europe | 97.2 /100 | #81 | Exceptional 85.2% |
Demographics Similar to Immigrants from Senegal by In Labor Force | Age 25-29
In terms of in labor force | age 25-29, the demographic groups most similar to Immigrants from Senegal are Icelander (84.8%, a difference of 0.0%), Immigrants from Asia (84.8%, a difference of 0.0%), Pakistani (84.8%, a difference of 0.010%), Sri Lankan (84.8%, a difference of 0.010%), and Immigrants from Laos (84.8%, a difference of 0.010%).
| Demographics | Rating | Rank | In Labor Force | Age 25-29 |
| Armenians | 72.7 /100 | #138 | Good 84.8% |
| Immigrants | Eastern Asia | 72.6 /100 | #139 | Good 84.8% |
| Immigrants | North America | 72.1 /100 | #140 | Good 84.8% |
| Danes | 71.9 /100 | #141 | Good 84.8% |
| Pakistanis | 70.0 /100 | #142 | Good 84.8% |
| Sri Lankans | 69.2 /100 | #143 | Good 84.8% |
| Immigrants | Laos | 69.0 /100 | #144 | Good 84.8% |
| Immigrants | Senegal | 68.3 /100 | #145 | Good 84.8% |
| Icelanders | 68.2 /100 | #146 | Good 84.8% |
| Immigrants | Asia | 68.2 /100 | #147 | Good 84.8% |
| Immigrants | England | 65.2 /100 | #148 | Good 84.7% |
| Peruvians | 64.7 /100 | #149 | Good 84.7% |
| Swiss | 64.7 /100 | #150 | Good 84.7% |
| Colombians | 62.8 /100 | #151 | Good 84.7% |
| Immigrants | Pakistan | 62.7 /100 | #152 | Good 84.7% |