Soviet Union vs U.S. Virgin Islander Associate's Degree
COMPARE
Soviet Union
U.S. Virgin Islander
Associate's Degree
Associate's Degree Comparison
Soviet Union
U.S. Virgin Islanders
55.1%
ASSOCIATE'S DEGREE
100.0/ 100
METRIC RATING
16th/ 347
METRIC RANK
42.1%
ASSOCIATE'S DEGREE
0.7/ 100
METRIC RATING
250th/ 347
METRIC RANK
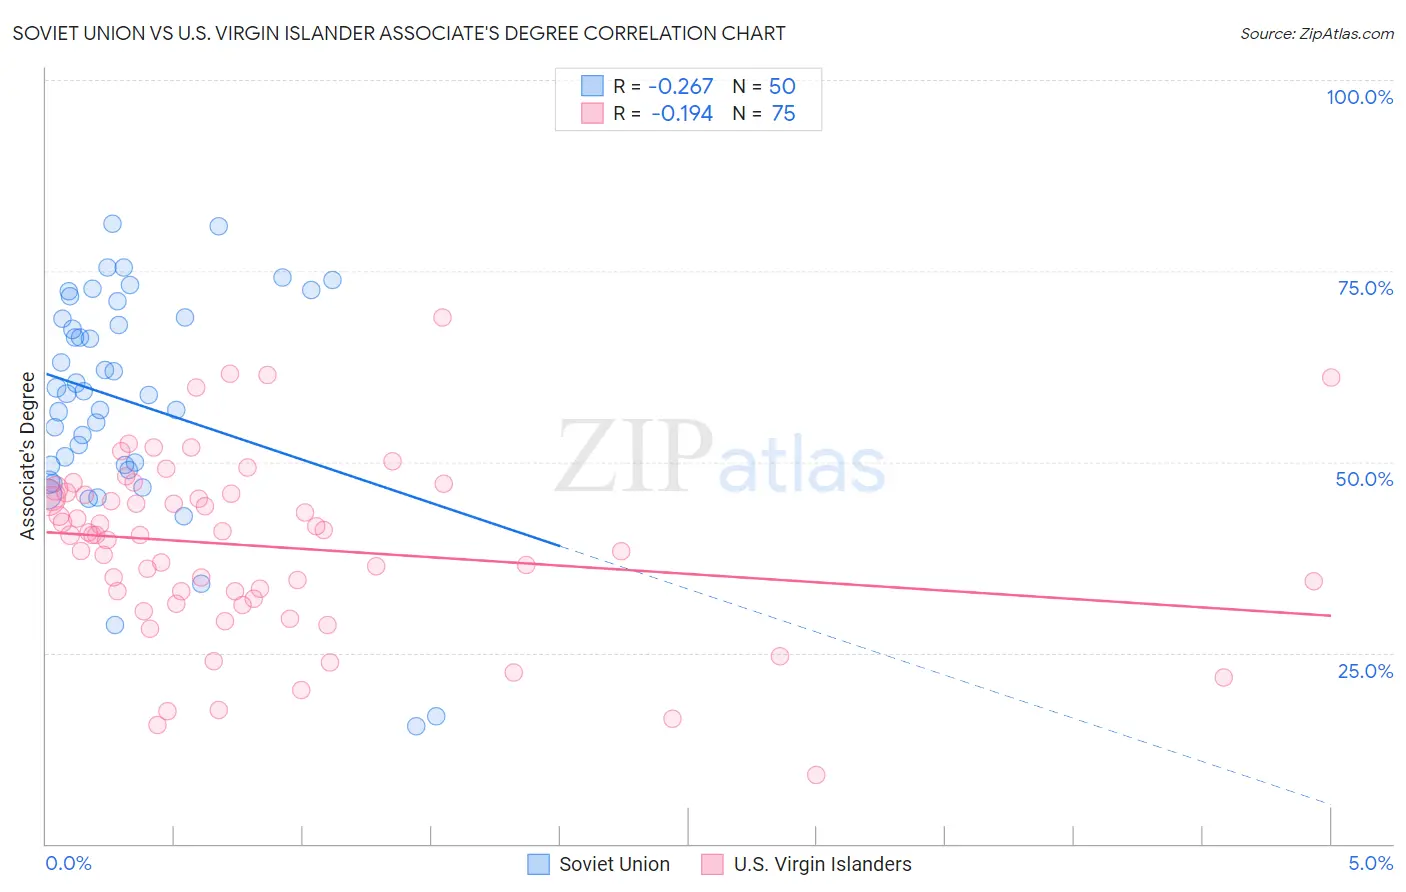
Soviet Union vs U.S. Virgin Islander Associate's Degree Correlation Chart
The statistical analysis conducted on geographies consisting of 43,514,626 people shows a weak negative correlation between the proportion of Soviet Union and percentage of population with at least associate's degree education in the United States with a correlation coefficient (R) of -0.267 and weighted average of 55.1%. Similarly, the statistical analysis conducted on geographies consisting of 87,527,119 people shows a poor negative correlation between the proportion of U.S. Virgin Islanders and percentage of population with at least associate's degree education in the United States with a correlation coefficient (R) of -0.194 and weighted average of 42.1%, a difference of 30.9%.
Associate's Degree Correlation Summary
| Measurement | Soviet Union | U.S. Virgin Islander |
| Minimum | 15.5% | 9.0% |
| Maximum | 81.2% | 68.9% |
| Range | 65.7% | 59.9% |
| Mean | 58.0% | 38.9% |
| Median | 59.1% | 40.4% |
| Interquartile 25% (IQ1) | 49.5% | 32.1% |
| Interquartile 75% (IQ3) | 68.9% | 45.9% |
| Interquartile Range (IQR) | 19.4% | 13.8% |
| Standard Deviation (Sample) | 14.7% | 11.6% |
| Standard Deviation (Population) | 14.5% | 11.5% |
Similar Demographics by Associate's Degree
Demographics Similar to Soviet Union by Associate's Degree
In terms of associate's degree, the demographic groups most similar to Soviet Union are Eastern European (55.0%, a difference of 0.14%), Immigrants from Eastern Asia (55.4%, a difference of 0.47%), Immigrants from Hong Kong (55.4%, a difference of 0.50%), Indian (Asian) (54.8%, a difference of 0.61%), and Immigrants from China (55.5%, a difference of 0.65%).
| Demographics | Rating | Rank | Associate's Degree |
| Immigrants | Israel | 100.0 /100 | #9 | Exceptional 56.8% |
| Cypriots | 100.0 /100 | #10 | Exceptional 56.4% |
| Immigrants | Australia | 100.0 /100 | #11 | Exceptional 55.8% |
| Immigrants | South Central Asia | 100.0 /100 | #12 | Exceptional 55.7% |
| Immigrants | China | 100.0 /100 | #13 | Exceptional 55.5% |
| Immigrants | Hong Kong | 100.0 /100 | #14 | Exceptional 55.4% |
| Immigrants | Eastern Asia | 100.0 /100 | #15 | Exceptional 55.4% |
| Soviet Union | 100.0 /100 | #16 | Exceptional 55.1% |
| Eastern Europeans | 100.0 /100 | #17 | Exceptional 55.0% |
| Indians (Asian) | 100.0 /100 | #18 | Exceptional 54.8% |
| Immigrants | Ireland | 100.0 /100 | #19 | Exceptional 54.7% |
| Cambodians | 100.0 /100 | #20 | Exceptional 54.6% |
| Immigrants | Sweden | 100.0 /100 | #21 | Exceptional 54.6% |
| Immigrants | Japan | 100.0 /100 | #22 | Exceptional 54.6% |
| Burmese | 100.0 /100 | #23 | Exceptional 54.6% |
Demographics Similar to U.S. Virgin Islanders by Associate's Degree
In terms of associate's degree, the demographic groups most similar to U.S. Virgin Islanders are Jamaican (42.1%, a difference of 0.010%), Immigrants from Bahamas (42.1%, a difference of 0.020%), Immigrants from Ecuador (42.2%, a difference of 0.16%), Immigrants from Fiji (42.2%, a difference of 0.24%), and Delaware (42.3%, a difference of 0.33%).
| Demographics | Rating | Rank | Associate's Degree |
| Guyanese | 1.0 /100 | #243 | Tragic 42.3% |
| Immigrants | Liberia | 0.9 /100 | #244 | Tragic 42.3% |
| Immigrants | Cambodia | 0.9 /100 | #245 | Tragic 42.3% |
| Delaware | 0.9 /100 | #246 | Tragic 42.3% |
| Immigrants | Fiji | 0.8 /100 | #247 | Tragic 42.2% |
| Immigrants | Ecuador | 0.8 /100 | #248 | Tragic 42.2% |
| Jamaicans | 0.7 /100 | #249 | Tragic 42.1% |
| U.S. Virgin Islanders | 0.7 /100 | #250 | Tragic 42.1% |
| Immigrants | Bahamas | 0.7 /100 | #251 | Tragic 42.1% |
| French American Indians | 0.6 /100 | #252 | Tragic 42.0% |
| Indonesians | 0.6 /100 | #253 | Tragic 41.9% |
| Cubans | 0.6 /100 | #254 | Tragic 41.9% |
| Immigrants | Guyana | 0.5 /100 | #255 | Tragic 41.8% |
| Immigrants | Congo | 0.5 /100 | #256 | Tragic 41.8% |
| Spanish Americans | 0.5 /100 | #257 | Tragic 41.8% |