Soviet Union vs Immigrants from North Macedonia Associate's Degree
COMPARE
Soviet Union
Immigrants from North Macedonia
Associate's Degree
Associate's Degree Comparison
Soviet Union
Immigrants from North Macedonia
55.1%
ASSOCIATE'S DEGREE
100.0/ 100
METRIC RATING
16th/ 347
METRIC RANK
47.4%
ASSOCIATE'S DEGREE
76.0/ 100
METRIC RATING
151st/ 347
METRIC RANK
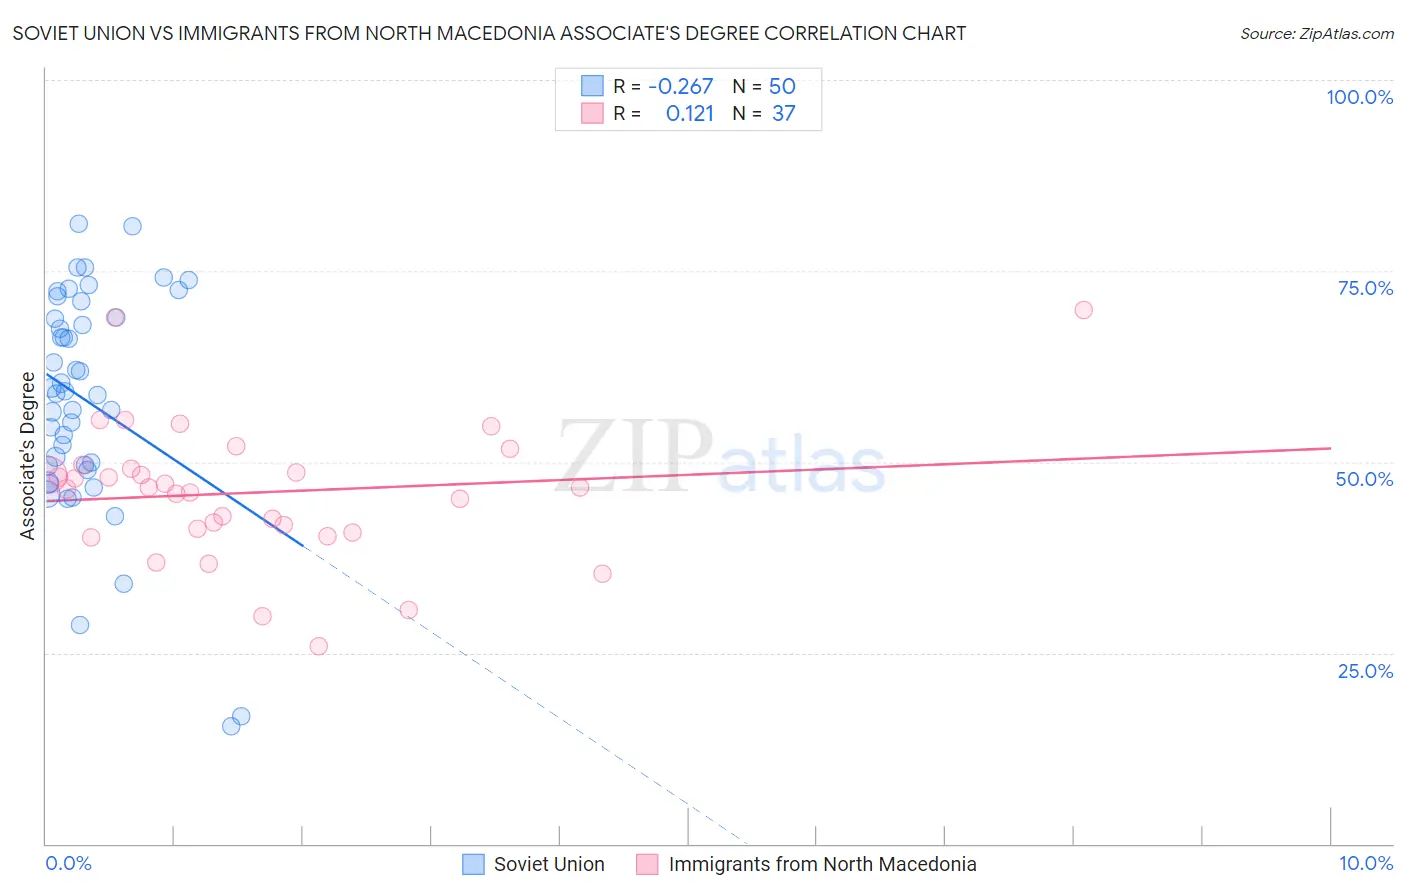
Soviet Union vs Immigrants from North Macedonia Associate's Degree Correlation Chart
The statistical analysis conducted on geographies consisting of 43,514,626 people shows a weak negative correlation between the proportion of Soviet Union and percentage of population with at least associate's degree education in the United States with a correlation coefficient (R) of -0.267 and weighted average of 55.1%. Similarly, the statistical analysis conducted on geographies consisting of 74,317,045 people shows a poor positive correlation between the proportion of Immigrants from North Macedonia and percentage of population with at least associate's degree education in the United States with a correlation coefficient (R) of 0.121 and weighted average of 47.4%, a difference of 16.4%.
Associate's Degree Correlation Summary
| Measurement | Soviet Union | Immigrants from North Macedonia |
| Minimum | 15.5% | 25.9% |
| Maximum | 81.2% | 69.8% |
| Range | 65.7% | 43.9% |
| Mean | 58.0% | 46.0% |
| Median | 59.1% | 46.6% |
| Interquartile 25% (IQ1) | 49.5% | 41.0% |
| Interquartile 75% (IQ3) | 68.9% | 49.3% |
| Interquartile Range (IQR) | 19.4% | 8.3% |
| Standard Deviation (Sample) | 14.7% | 9.0% |
| Standard Deviation (Population) | 14.5% | 8.9% |
Similar Demographics by Associate's Degree
Demographics Similar to Soviet Union by Associate's Degree
In terms of associate's degree, the demographic groups most similar to Soviet Union are Eastern European (55.0%, a difference of 0.14%), Immigrants from Eastern Asia (55.4%, a difference of 0.47%), Immigrants from Hong Kong (55.4%, a difference of 0.50%), Indian (Asian) (54.8%, a difference of 0.61%), and Immigrants from China (55.5%, a difference of 0.65%).
| Demographics | Rating | Rank | Associate's Degree |
| Immigrants | Israel | 100.0 /100 | #9 | Exceptional 56.8% |
| Cypriots | 100.0 /100 | #10 | Exceptional 56.4% |
| Immigrants | Australia | 100.0 /100 | #11 | Exceptional 55.8% |
| Immigrants | South Central Asia | 100.0 /100 | #12 | Exceptional 55.7% |
| Immigrants | China | 100.0 /100 | #13 | Exceptional 55.5% |
| Immigrants | Hong Kong | 100.0 /100 | #14 | Exceptional 55.4% |
| Immigrants | Eastern Asia | 100.0 /100 | #15 | Exceptional 55.4% |
| Soviet Union | 100.0 /100 | #16 | Exceptional 55.1% |
| Eastern Europeans | 100.0 /100 | #17 | Exceptional 55.0% |
| Indians (Asian) | 100.0 /100 | #18 | Exceptional 54.8% |
| Immigrants | Ireland | 100.0 /100 | #19 | Exceptional 54.7% |
| Cambodians | 100.0 /100 | #20 | Exceptional 54.6% |
| Immigrants | Sweden | 100.0 /100 | #21 | Exceptional 54.6% |
| Immigrants | Japan | 100.0 /100 | #22 | Exceptional 54.6% |
| Burmese | 100.0 /100 | #23 | Exceptional 54.6% |
Demographics Similar to Immigrants from North Macedonia by Associate's Degree
In terms of associate's degree, the demographic groups most similar to Immigrants from North Macedonia are Iraqi (47.4%, a difference of 0.020%), Immigrants from Armenia (47.4%, a difference of 0.060%), South American Indian (47.4%, a difference of 0.070%), Danish (47.4%, a difference of 0.14%), and Immigrants from Afghanistan (47.3%, a difference of 0.17%).
| Demographics | Rating | Rank | Associate's Degree |
| Slavs | 80.5 /100 | #144 | Excellent 47.6% |
| Canadians | 79.0 /100 | #145 | Good 47.5% |
| Immigrants | Sudan | 77.9 /100 | #146 | Good 47.4% |
| Danes | 77.3 /100 | #147 | Good 47.4% |
| South American Indians | 76.7 /100 | #148 | Good 47.4% |
| Immigrants | Armenia | 76.6 /100 | #149 | Good 47.4% |
| Iraqis | 76.2 /100 | #150 | Good 47.4% |
| Immigrants | North Macedonia | 76.0 /100 | #151 | Good 47.4% |
| Immigrants | Afghanistan | 74.3 /100 | #152 | Good 47.3% |
| Czechs | 72.2 /100 | #153 | Good 47.2% |
| Immigrants | Kenya | 72.1 /100 | #154 | Good 47.2% |
| Kenyans | 70.6 /100 | #155 | Good 47.1% |
| South Americans | 70.5 /100 | #156 | Good 47.1% |
| Sudanese | 70.3 /100 | #157 | Good 47.1% |
| Immigrants | Germany | 69.7 /100 | #158 | Good 47.1% |