Immigrants from Turkey vs West Indian College, 1 year or more
COMPARE
Immigrants from Turkey
West Indian
College, 1 year or more
College, 1 year or more Comparison
Immigrants from Turkey
West Indians
65.2%
COLLEGE, 1 YEAR OR MORE
99.9/ 100
METRIC RATING
35th/ 347
METRIC RANK
56.3%
COLLEGE, 1 YEAR OR MORE
1.8/ 100
METRIC RATING
235th/ 347
METRIC RANK
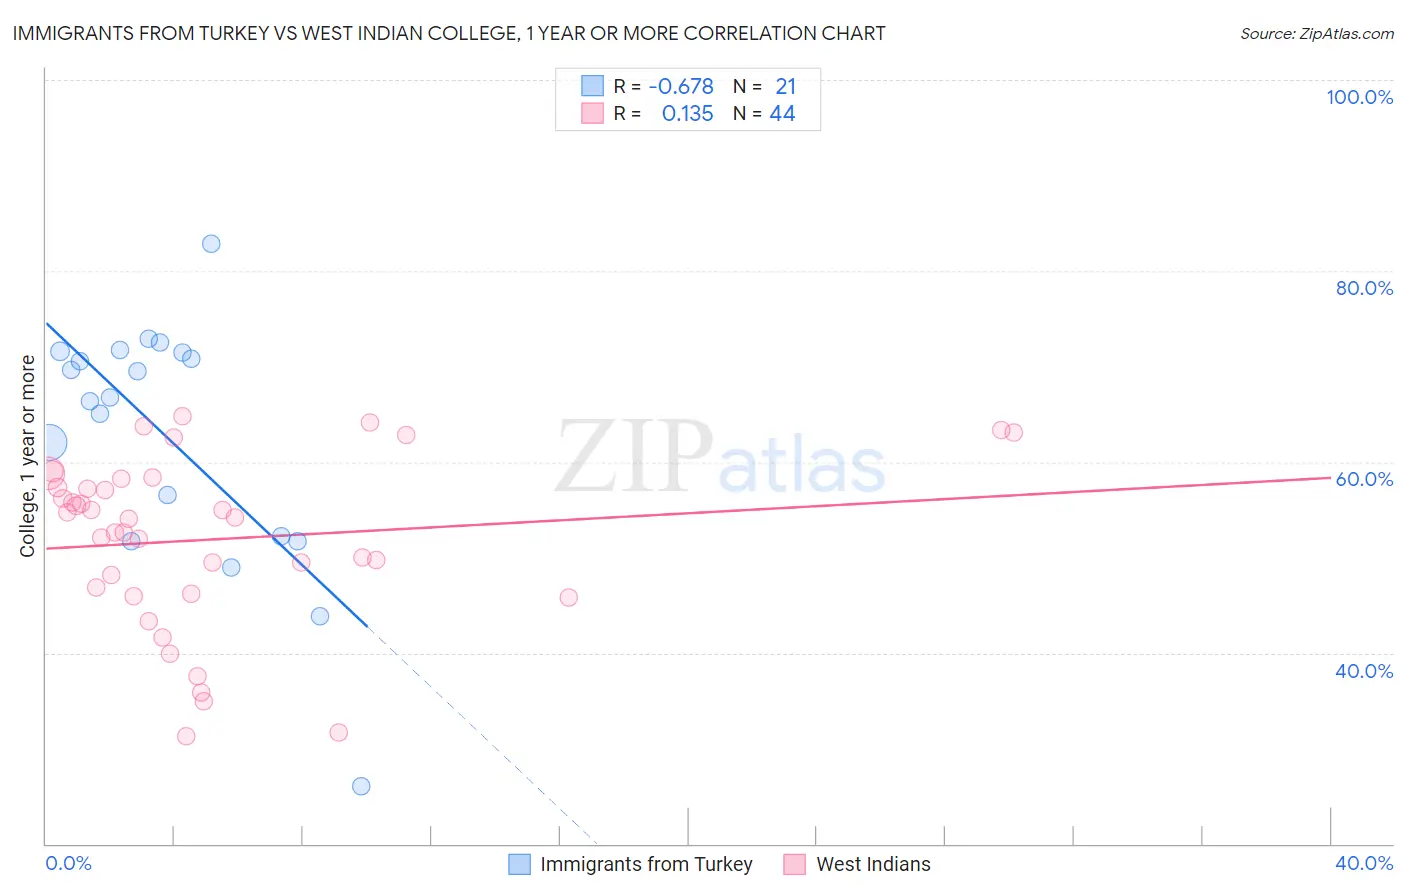
Immigrants from Turkey vs West Indian College, 1 year or more Correlation Chart
The statistical analysis conducted on geographies consisting of 223,057,840 people shows a significant negative correlation between the proportion of Immigrants from Turkey and percentage of population with at least college, 1 year or more education in the United States with a correlation coefficient (R) of -0.678 and weighted average of 65.2%. Similarly, the statistical analysis conducted on geographies consisting of 254,063,654 people shows a poor positive correlation between the proportion of West Indians and percentage of population with at least college, 1 year or more education in the United States with a correlation coefficient (R) of 0.135 and weighted average of 56.3%, a difference of 15.9%.
College, 1 year or more Correlation Summary
| Measurement | Immigrants from Turkey | West Indian |
| Minimum | 26.0% | 31.2% |
| Maximum | 82.8% | 64.8% |
| Range | 56.8% | 33.6% |
| Mean | 62.6% | 51.9% |
| Median | 66.8% | 54.1% |
| Interquartile 25% (IQ1) | 52.0% | 46.5% |
| Interquartile 75% (IQ3) | 71.5% | 57.8% |
| Interquartile Range (IQR) | 19.5% | 11.3% |
| Standard Deviation (Sample) | 13.0% | 8.9% |
| Standard Deviation (Population) | 12.7% | 8.8% |
Similar Demographics by College, 1 year or more
Demographics Similar to Immigrants from Turkey by College, 1 year or more
In terms of college, 1 year or more, the demographic groups most similar to Immigrants from Turkey are Immigrants from South Africa (65.1%, a difference of 0.080%), Russian (65.1%, a difference of 0.090%), Israeli (65.3%, a difference of 0.20%), Immigrants from Saudi Arabia (65.0%, a difference of 0.24%), and Estonian (65.0%, a difference of 0.31%).
| Demographics | Rating | Rank | College, 1 year or more |
| Immigrants | France | 100.0 /100 | #28 | Exceptional 65.8% |
| Immigrants | Northern Europe | 100.0 /100 | #29 | Exceptional 65.6% |
| Immigrants | Denmark | 100.0 /100 | #30 | Exceptional 65.6% |
| Turks | 100.0 /100 | #31 | Exceptional 65.5% |
| Bulgarians | 100.0 /100 | #32 | Exceptional 65.5% |
| Immigrants | Sri Lanka | 99.9 /100 | #33 | Exceptional 65.4% |
| Israelis | 99.9 /100 | #34 | Exceptional 65.3% |
| Immigrants | Turkey | 99.9 /100 | #35 | Exceptional 65.2% |
| Immigrants | South Africa | 99.9 /100 | #36 | Exceptional 65.1% |
| Russians | 99.9 /100 | #37 | Exceptional 65.1% |
| Immigrants | Saudi Arabia | 99.9 /100 | #38 | Exceptional 65.0% |
| Estonians | 99.9 /100 | #39 | Exceptional 65.0% |
| Immigrants | Kuwait | 99.9 /100 | #40 | Exceptional 65.0% |
| Mongolians | 99.9 /100 | #41 | Exceptional 64.8% |
| Immigrants | Latvia | 99.9 /100 | #42 | Exceptional 64.8% |
Demographics Similar to West Indians by College, 1 year or more
In terms of college, 1 year or more, the demographic groups most similar to West Indians are Spanish American (56.3%, a difference of 0.0%), Iroquois (56.2%, a difference of 0.050%), Samoan (56.2%, a difference of 0.16%), Barbadian (56.0%, a difference of 0.43%), and Nonimmigrants (56.5%, a difference of 0.45%).
| Demographics | Rating | Rank | College, 1 year or more |
| Immigrants | Fiji | 4.0 /100 | #228 | Tragic 56.9% |
| Cree | 3.6 /100 | #229 | Tragic 56.8% |
| Liberians | 3.1 /100 | #230 | Tragic 56.7% |
| Immigrants | Burma/Myanmar | 2.7 /100 | #231 | Tragic 56.6% |
| Immigrants | Bangladesh | 2.6 /100 | #232 | Tragic 56.6% |
| Immigrants | Nonimmigrants | 2.5 /100 | #233 | Tragic 56.5% |
| Spanish Americans | 1.8 /100 | #234 | Tragic 56.3% |
| West Indians | 1.8 /100 | #235 | Tragic 56.3% |
| Iroquois | 1.7 /100 | #236 | Tragic 56.2% |
| Samoans | 1.6 /100 | #237 | Tragic 56.2% |
| Barbadians | 1.3 /100 | #238 | Tragic 56.0% |
| Puget Sound Salish | 1.1 /100 | #239 | Tragic 55.9% |
| Trinidadians and Tobagonians | 1.1 /100 | #240 | Tragic 55.8% |
| French American Indians | 1.0 /100 | #241 | Tragic 55.8% |
| Marshallese | 1.0 /100 | #242 | Tragic 55.8% |