Immigrants vs West Indian College, 1 year or more
COMPARE
Immigrants
West Indian
College, 1 year or more
College, 1 year or more Comparison
Immigrants
West Indians
57.0%
COLLEGE, 1 YEAR OR MORE
4.4/ 100
METRIC RATING
227th/ 347
METRIC RANK
56.3%
COLLEGE, 1 YEAR OR MORE
1.8/ 100
METRIC RATING
235th/ 347
METRIC RANK
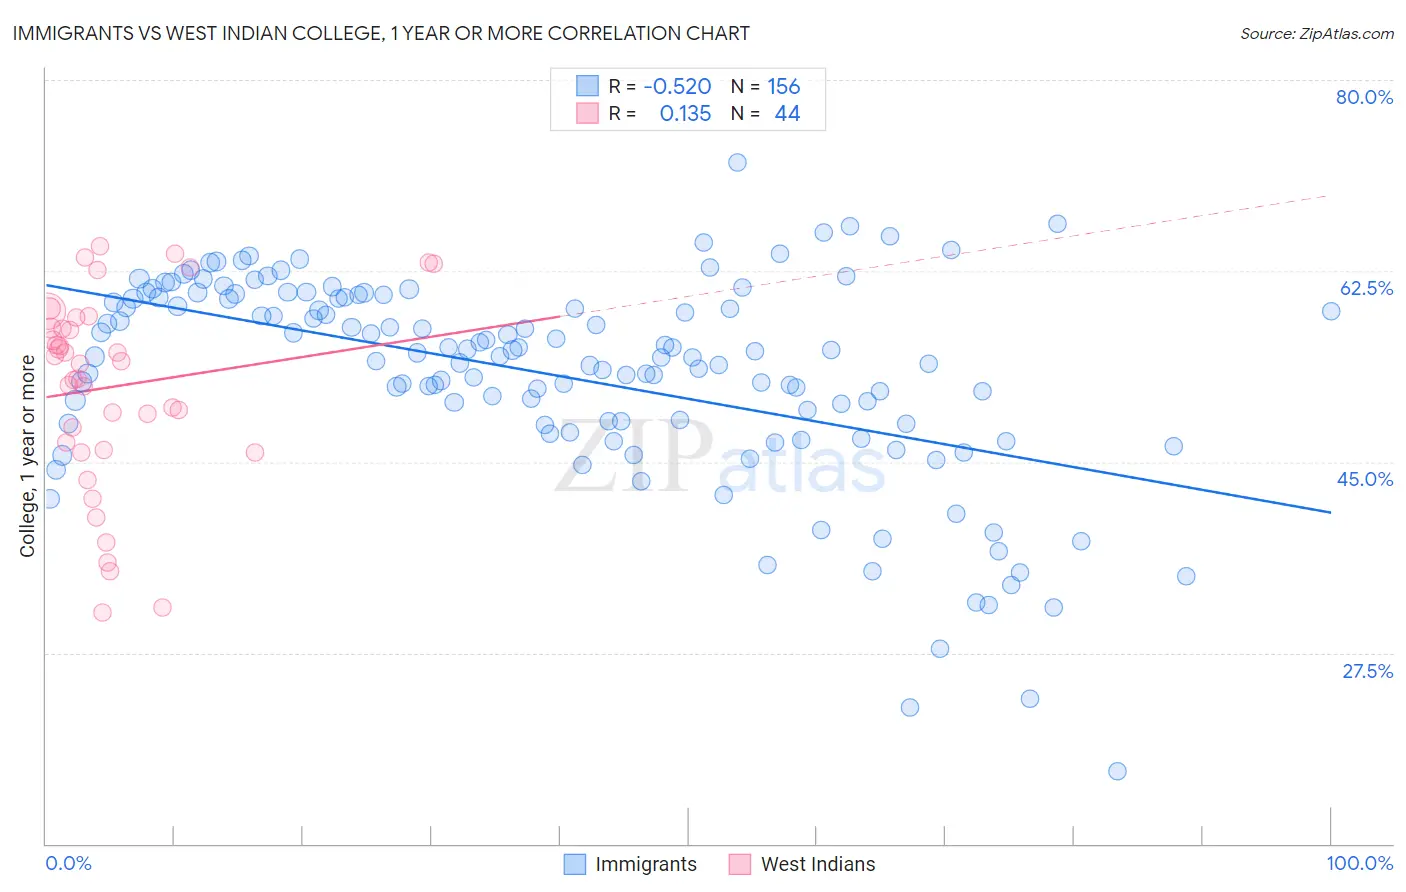
Immigrants vs West Indian College, 1 year or more Correlation Chart
The statistical analysis conducted on geographies consisting of 577,748,895 people shows a substantial negative correlation between the proportion of Immigrants and percentage of population with at least college, 1 year or more education in the United States with a correlation coefficient (R) of -0.520 and weighted average of 57.0%. Similarly, the statistical analysis conducted on geographies consisting of 254,063,654 people shows a poor positive correlation between the proportion of West Indians and percentage of population with at least college, 1 year or more education in the United States with a correlation coefficient (R) of 0.135 and weighted average of 56.3%, a difference of 1.3%.
College, 1 year or more Correlation Summary
| Measurement | Immigrants | West Indian |
| Minimum | 16.7% | 31.2% |
| Maximum | 72.4% | 64.8% |
| Range | 55.7% | 33.6% |
| Mean | 52.9% | 51.9% |
| Median | 54.7% | 54.1% |
| Interquartile 25% (IQ1) | 48.5% | 46.5% |
| Interquartile 75% (IQ3) | 60.0% | 57.8% |
| Interquartile Range (IQR) | 11.5% | 11.3% |
| Standard Deviation (Sample) | 9.5% | 8.9% |
| Standard Deviation (Population) | 9.5% | 8.8% |
Demographics Similar to Immigrants and West Indians by College, 1 year or more
In terms of college, 1 year or more, the demographic groups most similar to Immigrants are Immigrants from Western Africa (57.0%, a difference of 0.070%), Vietnamese (57.0%, a difference of 0.090%), Immigrants from Fiji (56.9%, a difference of 0.15%), Cree (56.8%, a difference of 0.28%), and Portuguese (57.2%, a difference of 0.30%). Similarly, the demographic groups most similar to West Indians are Spanish American (56.3%, a difference of 0.0%), Iroquois (56.2%, a difference of 0.050%), Samoan (56.2%, a difference of 0.16%), Barbadian (56.0%, a difference of 0.43%), and Nonimmigrants (56.5%, a difference of 0.45%).
| Demographics | Rating | Rank | College, 1 year or more |
| Immigrants | Ghana | 7.7 /100 | #221 | Tragic 57.4% |
| Sub-Saharan Africans | 6.1 /100 | #222 | Tragic 57.3% |
| Portuguese | 5.4 /100 | #223 | Tragic 57.2% |
| Hmong | 5.4 /100 | #224 | Tragic 57.2% |
| Vietnamese | 4.7 /100 | #225 | Tragic 57.0% |
| Immigrants | Western Africa | 4.6 /100 | #226 | Tragic 57.0% |
| Immigrants | Immigrants | 4.4 /100 | #227 | Tragic 57.0% |
| Immigrants | Fiji | 4.0 /100 | #228 | Tragic 56.9% |
| Cree | 3.6 /100 | #229 | Tragic 56.8% |
| Liberians | 3.1 /100 | #230 | Tragic 56.7% |
| Immigrants | Burma/Myanmar | 2.7 /100 | #231 | Tragic 56.6% |
| Immigrants | Bangladesh | 2.6 /100 | #232 | Tragic 56.6% |
| Immigrants | Nonimmigrants | 2.5 /100 | #233 | Tragic 56.5% |
| Spanish Americans | 1.8 /100 | #234 | Tragic 56.3% |
| West Indians | 1.8 /100 | #235 | Tragic 56.3% |
| Iroquois | 1.7 /100 | #236 | Tragic 56.2% |
| Samoans | 1.6 /100 | #237 | Tragic 56.2% |
| Barbadians | 1.3 /100 | #238 | Tragic 56.0% |
| Puget Sound Salish | 1.1 /100 | #239 | Tragic 55.9% |
| Trinidadians and Tobagonians | 1.1 /100 | #240 | Tragic 55.8% |
| French American Indians | 1.0 /100 | #241 | Tragic 55.8% |