Immigrants from Vietnam vs Sioux College, Under 1 year
COMPARE
Immigrants from Vietnam
Sioux
College, Under 1 year
College, Under 1 year Comparison
Immigrants from Vietnam
Sioux
64.0%
COLLEGE, UNDER 1 YEAR
12.1/ 100
METRIC RATING
208th/ 347
METRIC RANK
59.4%
COLLEGE, UNDER 1 YEAR
0.0/ 100
METRIC RATING
287th/ 347
METRIC RANK
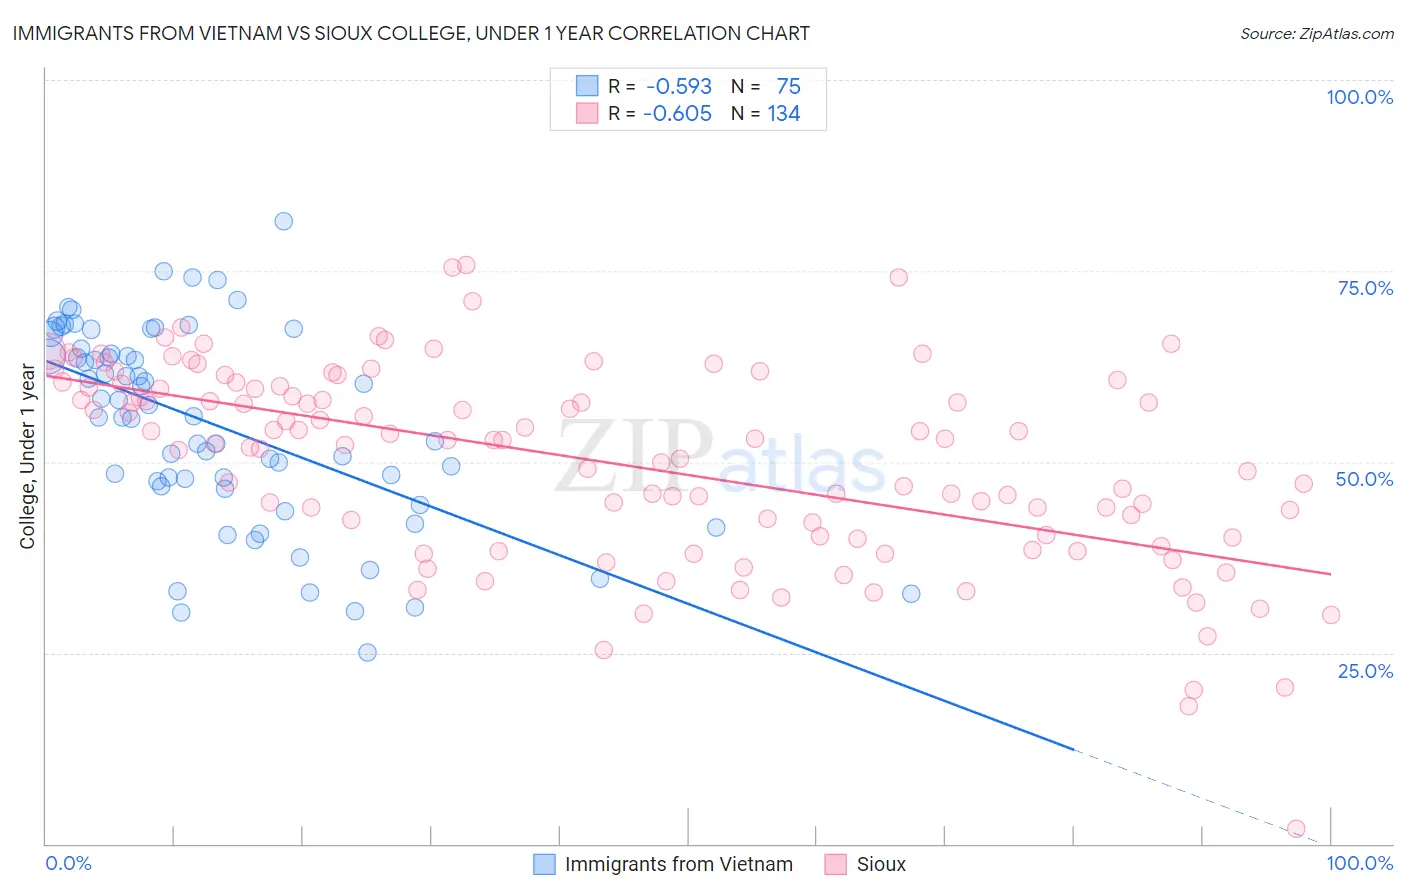
Immigrants from Vietnam vs Sioux College, Under 1 year Correlation Chart
The statistical analysis conducted on geographies consisting of 404,840,202 people shows a substantial negative correlation between the proportion of Immigrants from Vietnam and percentage of population with at least college, under 1 year education in the United States with a correlation coefficient (R) of -0.593 and weighted average of 64.0%. Similarly, the statistical analysis conducted on geographies consisting of 234,200,116 people shows a significant negative correlation between the proportion of Sioux and percentage of population with at least college, under 1 year education in the United States with a correlation coefficient (R) of -0.605 and weighted average of 59.4%, a difference of 7.6%.
College, Under 1 year Correlation Summary
| Measurement | Immigrants from Vietnam | Sioux |
| Minimum | 25.0% | 2.0% |
| Maximum | 81.5% | 75.8% |
| Range | 56.5% | 73.8% |
| Mean | 54.8% | 50.0% |
| Median | 56.0% | 52.8% |
| Interquartile 25% (IQ1) | 46.8% | 40.2% |
| Interquartile 75% (IQ3) | 64.8% | 59.9% |
| Interquartile Range (IQR) | 17.9% | 19.7% |
| Standard Deviation (Sample) | 12.9% | 12.9% |
| Standard Deviation (Population) | 12.8% | 12.9% |
Similar Demographics by College, Under 1 year
Demographics Similar to Immigrants from Vietnam by College, Under 1 year
In terms of college, under 1 year, the demographic groups most similar to Immigrants from Vietnam are Colombian (64.0%, a difference of 0.030%), White/Caucasian (64.0%, a difference of 0.070%), Puget Sound Salish (63.9%, a difference of 0.090%), Ghanaian (63.9%, a difference of 0.10%), and Peruvian (64.1%, a difference of 0.16%).
| Demographics | Rating | Rank | College, Under 1 year |
| French Canadians | 16.3 /100 | #201 | Poor 64.2% |
| South Americans | 16.2 /100 | #202 | Poor 64.2% |
| Uruguayans | 15.6 /100 | #203 | Poor 64.2% |
| Immigrants | Zaire | 14.6 /100 | #204 | Poor 64.1% |
| Peruvians | 13.7 /100 | #205 | Poor 64.1% |
| Whites/Caucasians | 12.8 /100 | #206 | Poor 64.0% |
| Colombians | 12.4 /100 | #207 | Poor 64.0% |
| Immigrants | Vietnam | 12.1 /100 | #208 | Poor 64.0% |
| Puget Sound Salish | 11.3 /100 | #209 | Poor 63.9% |
| Ghanaians | 11.2 /100 | #210 | Poor 63.9% |
| Native Hawaiians | 10.6 /100 | #211 | Poor 63.9% |
| Immigrants | Middle Africa | 10.5 /100 | #212 | Poor 63.9% |
| Immigrants | South America | 9.1 /100 | #213 | Tragic 63.8% |
| Immigrants | Nigeria | 8.8 /100 | #214 | Tragic 63.7% |
| Senegalese | 7.7 /100 | #215 | Tragic 63.6% |
Demographics Similar to Sioux by College, Under 1 year
In terms of college, under 1 year, the demographic groups most similar to Sioux are Black/African American (59.4%, a difference of 0.10%), British West Indian (59.5%, a difference of 0.17%), Choctaw (59.3%, a difference of 0.17%), Ecuadorian (59.3%, a difference of 0.21%), and Creek (59.3%, a difference of 0.29%).
| Demographics | Rating | Rank | College, Under 1 year |
| Crow | 0.1 /100 | #280 | Tragic 60.2% |
| Cherokee | 0.1 /100 | #281 | Tragic 60.1% |
| Belizeans | 0.1 /100 | #282 | Tragic 60.1% |
| Immigrants | Jamaica | 0.0 /100 | #283 | Tragic 59.7% |
| Immigrants | St. Vincent and the Grenadines | 0.0 /100 | #284 | Tragic 59.6% |
| Paiute | 0.0 /100 | #285 | Tragic 59.6% |
| British West Indians | 0.0 /100 | #286 | Tragic 59.5% |
| Sioux | 0.0 /100 | #287 | Tragic 59.4% |
| Blacks/African Americans | 0.0 /100 | #288 | Tragic 59.4% |
| Choctaw | 0.0 /100 | #289 | Tragic 59.3% |
| Ecuadorians | 0.0 /100 | #290 | Tragic 59.3% |
| Creek | 0.0 /100 | #291 | Tragic 59.3% |
| Nicaraguans | 0.0 /100 | #292 | Tragic 59.2% |
| Seminole | 0.0 /100 | #293 | Tragic 59.1% |
| Immigrants | Belize | 0.0 /100 | #294 | Tragic 59.1% |