South African vs Immigrants from Scotland Master's Degree
COMPARE
South African
Immigrants from Scotland
Master's Degree
Master's Degree Comparison
South Africans
Immigrants from Scotland
18.1%
MASTER'S DEGREE
99.9/ 100
METRIC RATING
64th/ 347
METRIC RANK
17.4%
MASTER'S DEGREE
99.4/ 100
METRIC RATING
84th/ 347
METRIC RANK
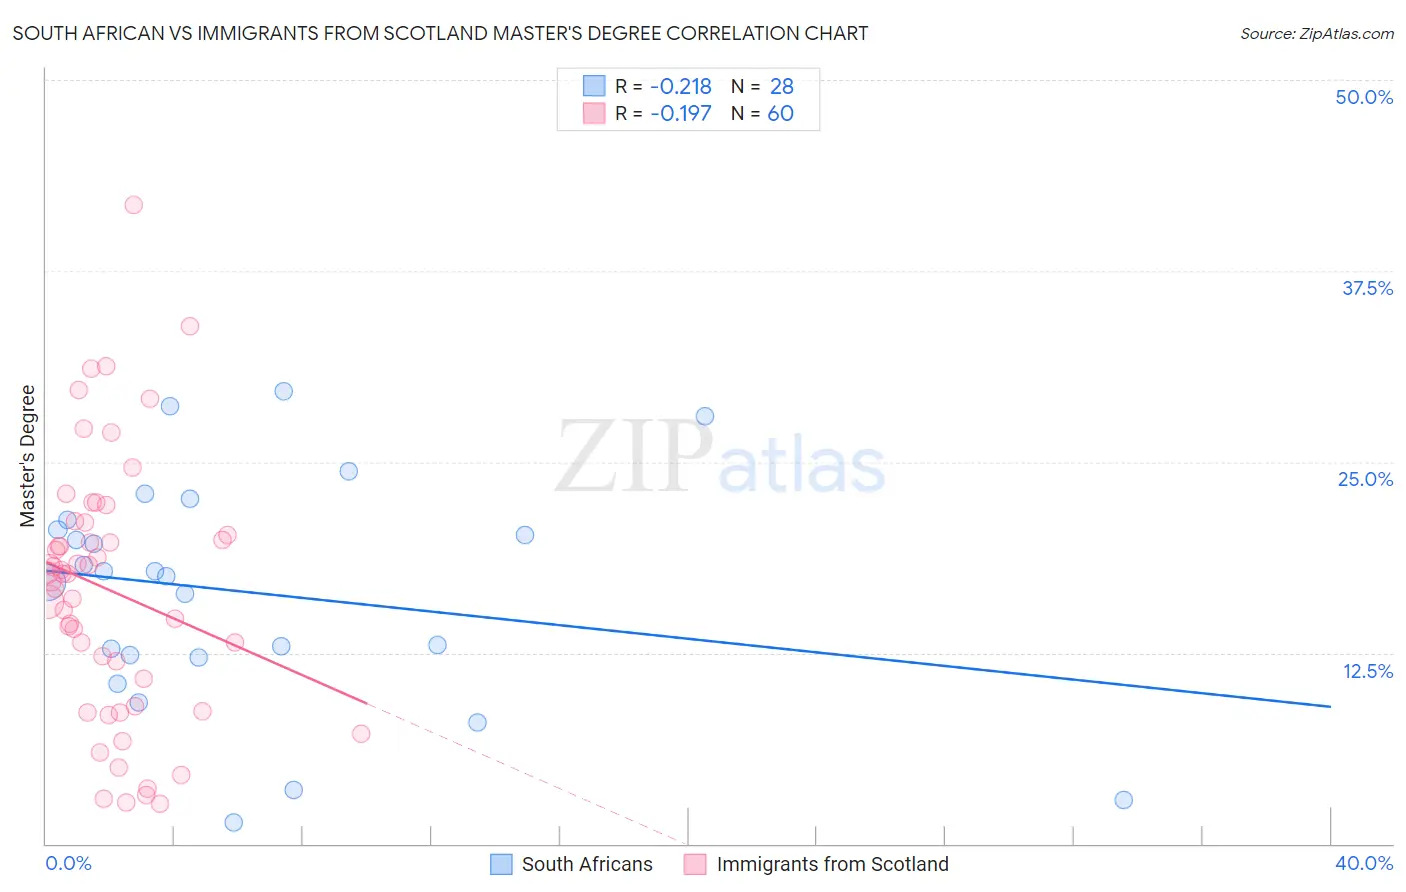
South African vs Immigrants from Scotland Master's Degree Correlation Chart
The statistical analysis conducted on geographies consisting of 182,576,527 people shows a weak negative correlation between the proportion of South Africans and percentage of population with at least master's degree education in the United States with a correlation coefficient (R) of -0.218 and weighted average of 18.1%. Similarly, the statistical analysis conducted on geographies consisting of 196,383,554 people shows a poor negative correlation between the proportion of Immigrants from Scotland and percentage of population with at least master's degree education in the United States with a correlation coefficient (R) of -0.197 and weighted average of 17.4%, a difference of 4.1%.
Master's Degree Correlation Summary
| Measurement | South African | Immigrants from Scotland |
| Minimum | 1.4% | 2.6% |
| Maximum | 29.6% | 41.8% |
| Range | 28.2% | 39.2% |
| Mean | 16.5% | 16.6% |
| Median | 17.7% | 17.7% |
| Interquartile 25% (IQ1) | 12.3% | 9.9% |
| Interquartile 75% (IQ3) | 20.9% | 20.6% |
| Interquartile Range (IQR) | 8.6% | 10.7% |
| Standard Deviation (Sample) | 7.4% | 8.4% |
| Standard Deviation (Population) | 7.3% | 8.3% |
Demographics Similar to South Africans and Immigrants from Scotland by Master's Degree
In terms of master's degree, the demographic groups most similar to South Africans are Immigrants from Kazakhstan (18.0%, a difference of 0.70%), Ethiopian (18.0%, a difference of 0.73%), Immigrants from Argentina (18.0%, a difference of 0.78%), Immigrants from Ethiopia (17.9%, a difference of 1.0%), and Immigrants from Uzbekistan (17.9%, a difference of 1.3%). Similarly, the demographic groups most similar to Immigrants from Scotland are Immigrants from Zimbabwe (17.4%, a difference of 0.33%), Greek (17.5%, a difference of 0.39%), Immigrants from Western Asia (17.5%, a difference of 0.44%), Carpatho Rusyn (17.5%, a difference of 0.74%), and Immigrants from Lebanon (17.5%, a difference of 0.79%).
| Demographics | Rating | Rank | Master's Degree |
| South Africans | 99.9 /100 | #64 | Exceptional 18.1% |
| Immigrants | Kazakhstan | 99.8 /100 | #65 | Exceptional 18.0% |
| Ethiopians | 99.8 /100 | #66 | Exceptional 18.0% |
| Immigrants | Argentina | 99.8 /100 | #67 | Exceptional 18.0% |
| Immigrants | Ethiopia | 99.8 /100 | #68 | Exceptional 17.9% |
| Immigrants | Uzbekistan | 99.8 /100 | #69 | Exceptional 17.9% |
| Immigrants | Western Europe | 99.8 /100 | #70 | Exceptional 17.8% |
| Immigrants | Pakistan | 99.7 /100 | #71 | Exceptional 17.8% |
| Lithuanians | 99.7 /100 | #72 | Exceptional 17.7% |
| Zimbabweans | 99.7 /100 | #73 | Exceptional 17.7% |
| Immigrants | Romania | 99.7 /100 | #74 | Exceptional 17.7% |
| Egyptians | 99.6 /100 | #75 | Exceptional 17.6% |
| Immigrants | Indonesia | 99.6 /100 | #76 | Exceptional 17.6% |
| Immigrants | Eastern Europe | 99.6 /100 | #77 | Exceptional 17.6% |
| Immigrants | Hungary | 99.6 /100 | #78 | Exceptional 17.5% |
| Immigrants | Lebanon | 99.6 /100 | #79 | Exceptional 17.5% |
| Carpatho Rusyns | 99.6 /100 | #80 | Exceptional 17.5% |
| Immigrants | Western Asia | 99.5 /100 | #81 | Exceptional 17.5% |
| Greeks | 99.5 /100 | #82 | Exceptional 17.5% |
| Immigrants | Zimbabwe | 99.5 /100 | #83 | Exceptional 17.4% |
| Immigrants | Scotland | 99.4 /100 | #84 | Exceptional 17.4% |