South African vs Immigrants from Honduras Master's Degree
COMPARE
South African
Immigrants from Honduras
Master's Degree
Master's Degree Comparison
South Africans
Immigrants from Honduras
18.1%
MASTER'S DEGREE
99.9/ 100
METRIC RATING
64th/ 347
METRIC RANK
11.8%
MASTER'S DEGREE
0.1/ 100
METRIC RATING
288th/ 347
METRIC RANK
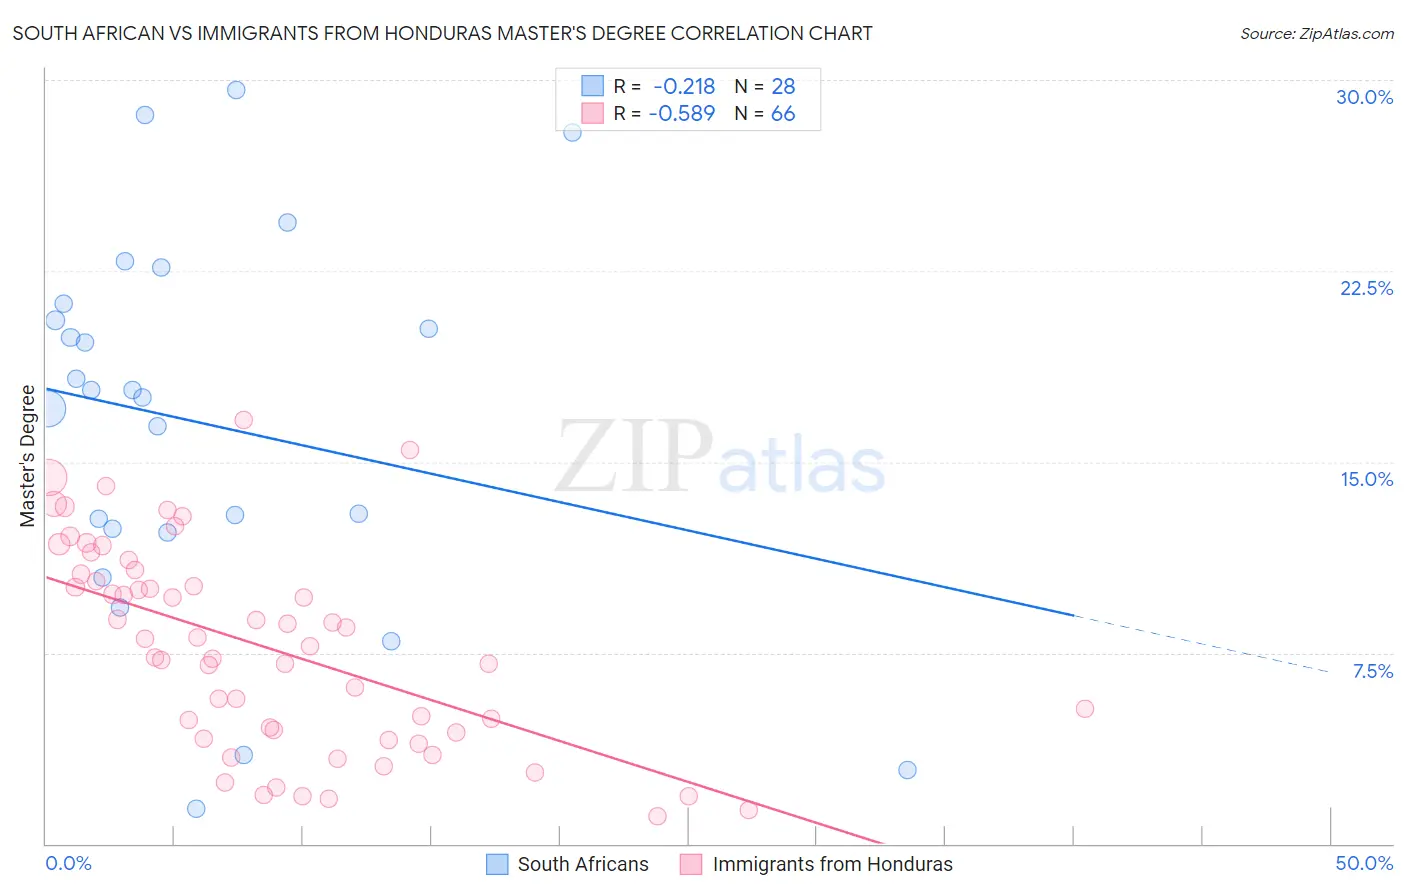
South African vs Immigrants from Honduras Master's Degree Correlation Chart
The statistical analysis conducted on geographies consisting of 182,576,527 people shows a weak negative correlation between the proportion of South Africans and percentage of population with at least master's degree education in the United States with a correlation coefficient (R) of -0.218 and weighted average of 18.1%. Similarly, the statistical analysis conducted on geographies consisting of 322,506,731 people shows a substantial negative correlation between the proportion of Immigrants from Honduras and percentage of population with at least master's degree education in the United States with a correlation coefficient (R) of -0.589 and weighted average of 11.8%, a difference of 53.9%.
Master's Degree Correlation Summary
| Measurement | South African | Immigrants from Honduras |
| Minimum | 1.4% | 1.1% |
| Maximum | 29.6% | 16.7% |
| Range | 28.2% | 15.6% |
| Mean | 16.5% | 7.7% |
| Median | 17.7% | 7.9% |
| Interquartile 25% (IQ1) | 12.3% | 4.4% |
| Interquartile 75% (IQ3) | 20.9% | 10.6% |
| Interquartile Range (IQR) | 8.6% | 6.2% |
| Standard Deviation (Sample) | 7.4% | 4.0% |
| Standard Deviation (Population) | 7.3% | 3.9% |
Similar Demographics by Master's Degree
Demographics Similar to South Africans by Master's Degree
In terms of master's degree, the demographic groups most similar to South Africans are Immigrants from Netherlands (18.1%, a difference of 0.080%), Argentinean (18.2%, a difference of 0.44%), Immigrants from Kazakhstan (18.0%, a difference of 0.70%), Ethiopian (18.0%, a difference of 0.73%), and Immigrants from Argentina (18.0%, a difference of 0.78%).
| Demographics | Rating | Rank | Master's Degree |
| Immigrants | Asia | 99.9 /100 | #57 | Exceptional 18.4% |
| Australians | 99.9 /100 | #58 | Exceptional 18.4% |
| Immigrants | Bulgaria | 99.9 /100 | #59 | Exceptional 18.3% |
| New Zealanders | 99.9 /100 | #60 | Exceptional 18.3% |
| Immigrants | Europe | 99.9 /100 | #61 | Exceptional 18.2% |
| Argentineans | 99.9 /100 | #62 | Exceptional 18.2% |
| Immigrants | Netherlands | 99.9 /100 | #63 | Exceptional 18.1% |
| South Africans | 99.9 /100 | #64 | Exceptional 18.1% |
| Immigrants | Kazakhstan | 99.8 /100 | #65 | Exceptional 18.0% |
| Ethiopians | 99.8 /100 | #66 | Exceptional 18.0% |
| Immigrants | Argentina | 99.8 /100 | #67 | Exceptional 18.0% |
| Immigrants | Ethiopia | 99.8 /100 | #68 | Exceptional 17.9% |
| Immigrants | Uzbekistan | 99.8 /100 | #69 | Exceptional 17.9% |
| Immigrants | Western Europe | 99.8 /100 | #70 | Exceptional 17.8% |
| Immigrants | Pakistan | 99.7 /100 | #71 | Exceptional 17.8% |
Demographics Similar to Immigrants from Honduras by Master's Degree
In terms of master's degree, the demographic groups most similar to Immigrants from Honduras are Guatemalan (11.7%, a difference of 0.080%), Immigrants from Haiti (11.8%, a difference of 0.17%), Ute (11.7%, a difference of 0.32%), Aleut (11.8%, a difference of 0.36%), and Immigrants from Nicaragua (11.8%, a difference of 0.72%).
| Demographics | Rating | Rank | Master's Degree |
| Malaysians | 0.2 /100 | #281 | Tragic 12.0% |
| Immigrants | El Salvador | 0.2 /100 | #282 | Tragic 12.0% |
| Hondurans | 0.2 /100 | #283 | Tragic 11.9% |
| Ottawa | 0.2 /100 | #284 | Tragic 11.9% |
| Immigrants | Nicaragua | 0.2 /100 | #285 | Tragic 11.8% |
| Aleuts | 0.1 /100 | #286 | Tragic 11.8% |
| Immigrants | Haiti | 0.1 /100 | #287 | Tragic 11.8% |
| Immigrants | Honduras | 0.1 /100 | #288 | Tragic 11.8% |
| Guatemalans | 0.1 /100 | #289 | Tragic 11.7% |
| Ute | 0.1 /100 | #290 | Tragic 11.7% |
| Colville | 0.1 /100 | #291 | Tragic 11.6% |
| Immigrants | Guatemala | 0.1 /100 | #292 | Tragic 11.6% |
| Alaska Natives | 0.1 /100 | #293 | Tragic 11.6% |
| Hawaiians | 0.1 /100 | #294 | Tragic 11.6% |
| Marshallese | 0.1 /100 | #295 | Tragic 11.6% |