Immigrants from Czechoslovakia vs Armenian College, Under 1 year
COMPARE
Immigrants from Czechoslovakia
Armenian
College, Under 1 year
College, Under 1 year Comparison
Immigrants from Czechoslovakia
Armenians
69.6%
COLLEGE, UNDER 1 YEAR
99.7/ 100
METRIC RATING
54th/ 347
METRIC RANK
68.1%
COLLEGE, UNDER 1 YEAR
97.7/ 100
METRIC RATING
94th/ 347
METRIC RANK
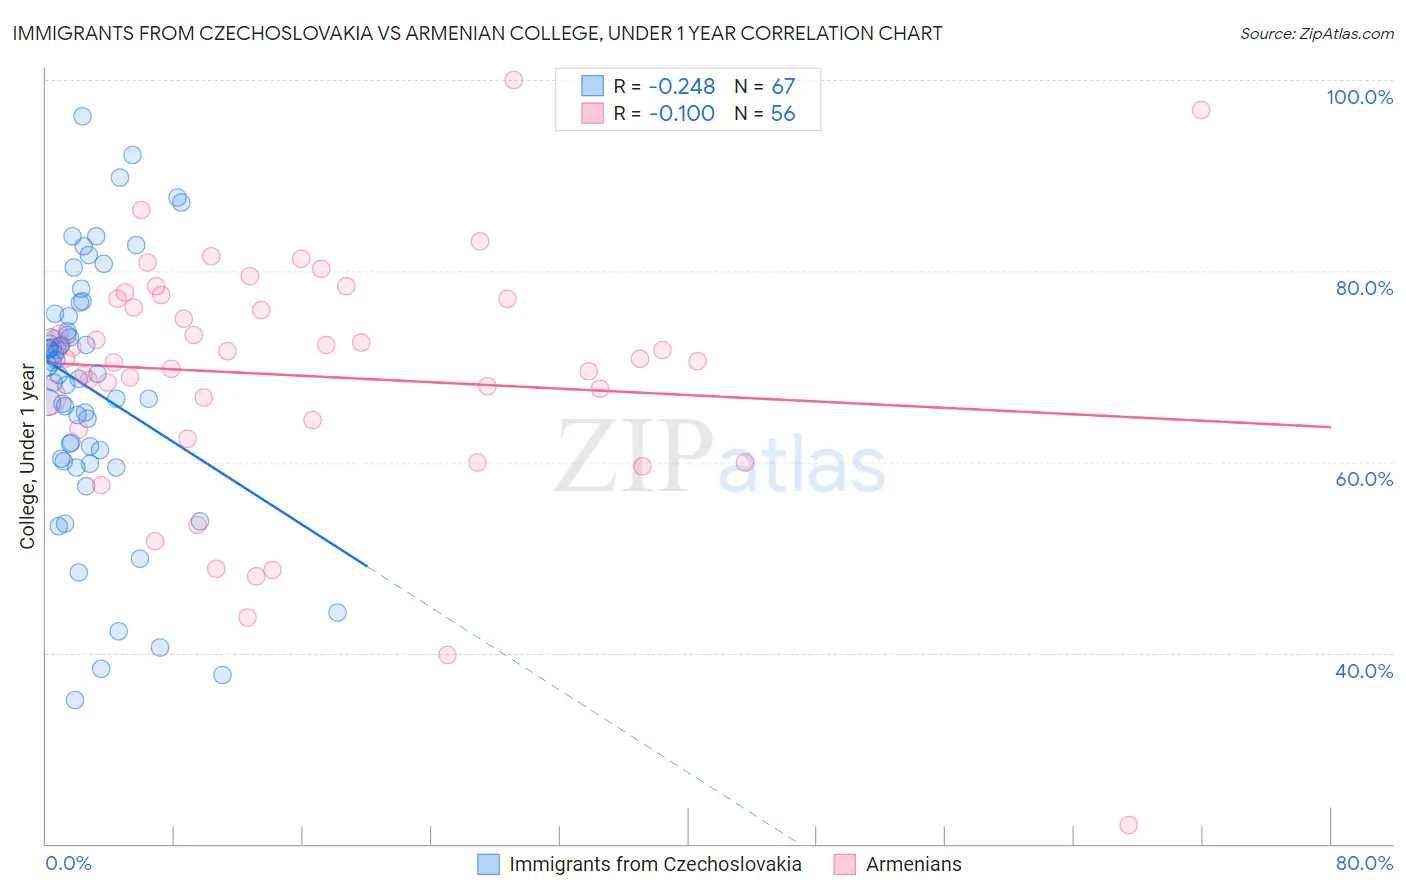
Immigrants from Czechoslovakia vs Armenian College, Under 1 year Correlation Chart
The statistical analysis conducted on geographies consisting of 195,448,477 people shows a weak negative correlation between the proportion of Immigrants from Czechoslovakia and percentage of population with at least college, under 1 year education in the United States with a correlation coefficient (R) of -0.248 and weighted average of 69.6%. Similarly, the statistical analysis conducted on geographies consisting of 310,952,332 people shows a poor negative correlation between the proportion of Armenians and percentage of population with at least college, under 1 year education in the United States with a correlation coefficient (R) of -0.100 and weighted average of 68.1%, a difference of 2.2%.
College, Under 1 year Correlation Summary
| Measurement | Immigrants from Czechoslovakia | Armenian |
| Minimum | 35.1% | 22.0% |
| Maximum | 96.2% | 100.0% |
| Range | 61.1% | 78.0% |
| Mean | 67.6% | 69.0% |
| Median | 69.2% | 70.8% |
| Interquartile 25% (IQ1) | 60.4% | 63.9% |
| Interquartile 75% (IQ3) | 75.3% | 77.1% |
| Interquartile Range (IQR) | 14.9% | 13.2% |
| Standard Deviation (Sample) | 13.2% | 13.2% |
| Standard Deviation (Population) | 13.1% | 13.1% |
Similar Demographics by College, Under 1 year
Demographics Similar to Immigrants from Czechoslovakia by College, Under 1 year
In terms of college, under 1 year, the demographic groups most similar to Immigrants from Czechoslovakia are Maltese (69.5%, a difference of 0.10%), South African (69.7%, a difference of 0.12%), Immigrants from Scotland (69.4%, a difference of 0.22%), Asian (69.4%, a difference of 0.25%), and Immigrants from Malaysia (69.3%, a difference of 0.34%).
| Demographics | Rating | Rank | College, Under 1 year |
| Immigrants | Bulgaria | 99.8 /100 | #47 | Exceptional 70.0% |
| Immigrants | Netherlands | 99.8 /100 | #48 | Exceptional 70.0% |
| Immigrants | Austria | 99.8 /100 | #49 | Exceptional 70.0% |
| Zimbabweans | 99.8 /100 | #50 | Exceptional 69.9% |
| Mongolians | 99.8 /100 | #51 | Exceptional 69.9% |
| Immigrants | Russia | 99.8 /100 | #52 | Exceptional 69.9% |
| South Africans | 99.7 /100 | #53 | Exceptional 69.7% |
| Immigrants | Czechoslovakia | 99.7 /100 | #54 | Exceptional 69.6% |
| Maltese | 99.7 /100 | #55 | Exceptional 69.5% |
| Immigrants | Scotland | 99.6 /100 | #56 | Exceptional 69.4% |
| Asians | 99.6 /100 | #57 | Exceptional 69.4% |
| Immigrants | Malaysia | 99.6 /100 | #58 | Exceptional 69.3% |
| Immigrants | Serbia | 99.5 /100 | #59 | Exceptional 69.3% |
| Immigrants | Asia | 99.5 /100 | #60 | Exceptional 69.2% |
| Immigrants | Kazakhstan | 99.5 /100 | #61 | Exceptional 69.2% |
Demographics Similar to Armenians by College, Under 1 year
In terms of college, under 1 year, the demographic groups most similar to Armenians are Romanian (68.2%, a difference of 0.090%), Immigrants from Pakistan (68.0%, a difference of 0.090%), Jordanian (68.0%, a difference of 0.13%), Immigrants from Ethiopia (68.0%, a difference of 0.15%), and Luxembourger (68.2%, a difference of 0.19%).
| Demographics | Rating | Rank | College, Under 1 year |
| Chinese | 98.3 /100 | #87 | Exceptional 68.3% |
| Croatians | 98.2 /100 | #88 | Exceptional 68.3% |
| Ethiopians | 98.2 /100 | #89 | Exceptional 68.3% |
| Icelanders | 98.1 /100 | #90 | Exceptional 68.3% |
| Europeans | 98.1 /100 | #91 | Exceptional 68.2% |
| Luxembourgers | 98.1 /100 | #92 | Exceptional 68.2% |
| Romanians | 97.9 /100 | #93 | Exceptional 68.2% |
| Armenians | 97.7 /100 | #94 | Exceptional 68.1% |
| Immigrants | Pakistan | 97.5 /100 | #95 | Exceptional 68.0% |
| Jordanians | 97.4 /100 | #96 | Exceptional 68.0% |
| Immigrants | Ethiopia | 97.3 /100 | #97 | Exceptional 68.0% |
| Paraguayans | 97.1 /100 | #98 | Exceptional 67.9% |
| Immigrants | Bolivia | 97.0 /100 | #99 | Exceptional 67.9% |
| Immigrants | Argentina | 97.0 /100 | #100 | Exceptional 67.9% |
| Immigrants | Eastern Europe | 96.9 /100 | #101 | Exceptional 67.9% |