Chippewa vs Armenian College, Under 1 year
COMPARE
Chippewa
Armenian
College, Under 1 year
College, Under 1 year Comparison
Chippewa
Armenians
62.6%
COLLEGE, UNDER 1 YEAR
2.0/ 100
METRIC RATING
234th/ 347
METRIC RANK
68.1%
COLLEGE, UNDER 1 YEAR
97.7/ 100
METRIC RATING
94th/ 347
METRIC RANK
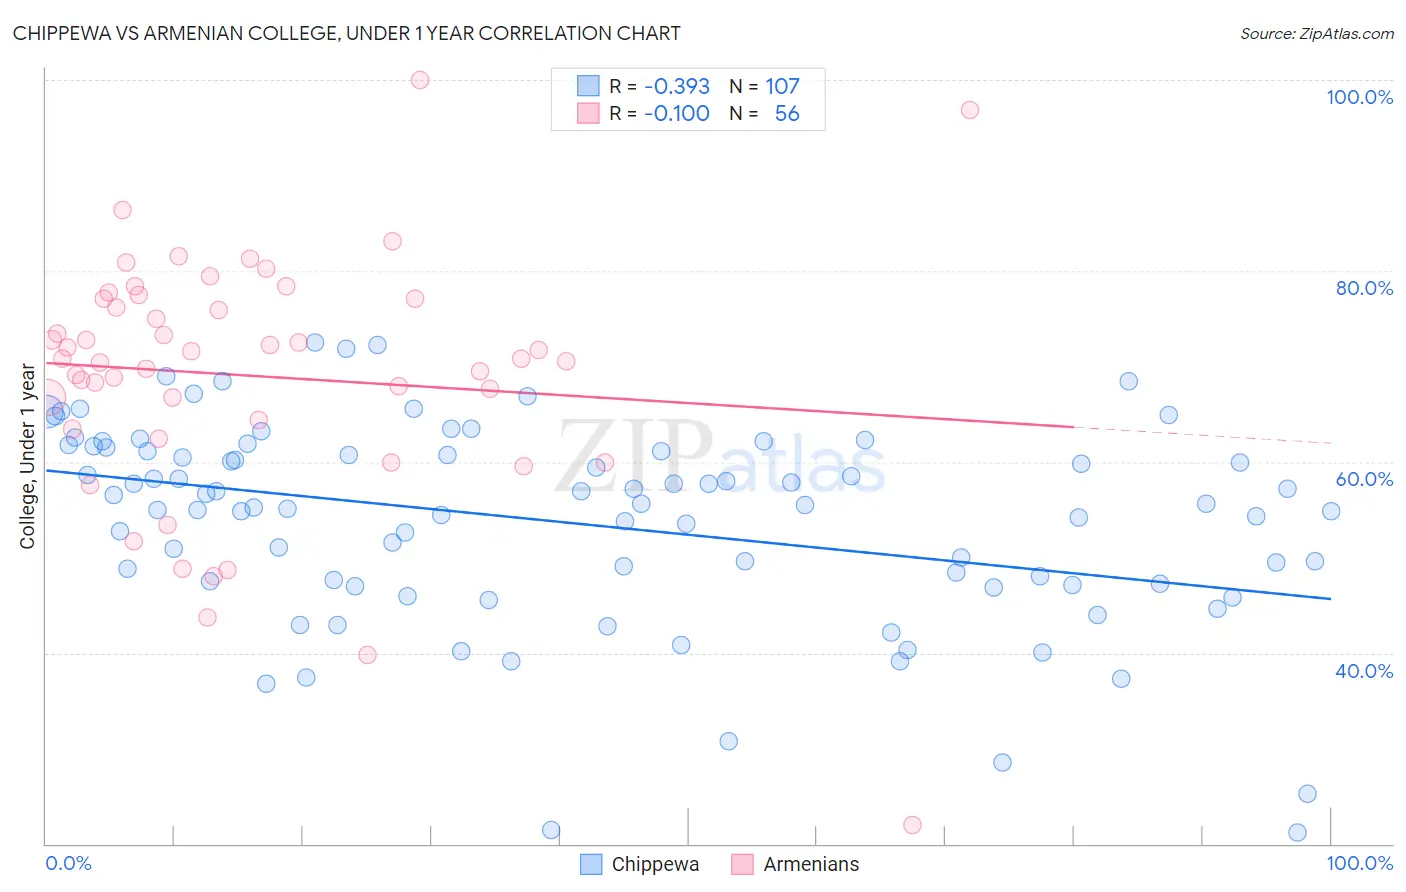
Chippewa vs Armenian College, Under 1 year Correlation Chart
The statistical analysis conducted on geographies consisting of 215,068,018 people shows a mild negative correlation between the proportion of Chippewa and percentage of population with at least college, under 1 year education in the United States with a correlation coefficient (R) of -0.393 and weighted average of 62.6%. Similarly, the statistical analysis conducted on geographies consisting of 310,952,332 people shows a poor negative correlation between the proportion of Armenians and percentage of population with at least college, under 1 year education in the United States with a correlation coefficient (R) of -0.100 and weighted average of 68.1%, a difference of 8.8%.
College, Under 1 year Correlation Summary
| Measurement | Chippewa | Armenian |
| Minimum | 21.2% | 22.0% |
| Maximum | 72.5% | 100.0% |
| Range | 51.3% | 78.0% |
| Mean | 53.6% | 69.0% |
| Median | 55.5% | 70.8% |
| Interquartile 25% (IQ1) | 47.2% | 63.9% |
| Interquartile 75% (IQ3) | 61.1% | 77.1% |
| Interquartile Range (IQR) | 14.0% | 13.2% |
| Standard Deviation (Sample) | 10.5% | 13.2% |
| Standard Deviation (Population) | 10.5% | 13.1% |
Similar Demographics by College, Under 1 year
Demographics Similar to Chippewa by College, Under 1 year
In terms of college, under 1 year, the demographic groups most similar to Chippewa are Iroquois (62.6%, a difference of 0.030%), Spanish American (62.6%, a difference of 0.050%), Osage (62.7%, a difference of 0.15%), Immigrants (62.5%, a difference of 0.18%), and Immigrants from Burma/Myanmar (62.5%, a difference of 0.21%).
| Demographics | Rating | Rank | College, Under 1 year |
| Immigrants | Ghana | 3.7 /100 | #227 | Tragic 63.1% |
| Samoans | 3.3 /100 | #228 | Tragic 63.0% |
| Liberians | 3.2 /100 | #229 | Tragic 63.0% |
| Immigrants | Nonimmigrants | 3.0 /100 | #230 | Tragic 62.9% |
| Immigrants | Western Africa | 2.4 /100 | #231 | Tragic 62.8% |
| Osage | 2.2 /100 | #232 | Tragic 62.7% |
| Iroquois | 2.0 /100 | #233 | Tragic 62.6% |
| Chippewa | 2.0 /100 | #234 | Tragic 62.6% |
| Spanish Americans | 1.9 /100 | #235 | Tragic 62.6% |
| Immigrants | Immigrants | 1.7 /100 | #236 | Tragic 62.5% |
| Immigrants | Burma/Myanmar | 1.6 /100 | #237 | Tragic 62.5% |
| French American Indians | 1.5 /100 | #238 | Tragic 62.4% |
| Nepalese | 1.1 /100 | #239 | Tragic 62.2% |
| Aleuts | 1.1 /100 | #240 | Tragic 62.2% |
| Ottawa | 1.1 /100 | #241 | Tragic 62.2% |
Demographics Similar to Armenians by College, Under 1 year
In terms of college, under 1 year, the demographic groups most similar to Armenians are Romanian (68.2%, a difference of 0.090%), Immigrants from Pakistan (68.0%, a difference of 0.090%), Jordanian (68.0%, a difference of 0.13%), Immigrants from Ethiopia (68.0%, a difference of 0.15%), and Luxembourger (68.2%, a difference of 0.19%).
| Demographics | Rating | Rank | College, Under 1 year |
| Chinese | 98.3 /100 | #87 | Exceptional 68.3% |
| Croatians | 98.2 /100 | #88 | Exceptional 68.3% |
| Ethiopians | 98.2 /100 | #89 | Exceptional 68.3% |
| Icelanders | 98.1 /100 | #90 | Exceptional 68.3% |
| Europeans | 98.1 /100 | #91 | Exceptional 68.2% |
| Luxembourgers | 98.1 /100 | #92 | Exceptional 68.2% |
| Romanians | 97.9 /100 | #93 | Exceptional 68.2% |
| Armenians | 97.7 /100 | #94 | Exceptional 68.1% |
| Immigrants | Pakistan | 97.5 /100 | #95 | Exceptional 68.0% |
| Jordanians | 97.4 /100 | #96 | Exceptional 68.0% |
| Immigrants | Ethiopia | 97.3 /100 | #97 | Exceptional 68.0% |
| Paraguayans | 97.1 /100 | #98 | Exceptional 67.9% |
| Immigrants | Bolivia | 97.0 /100 | #99 | Exceptional 67.9% |
| Immigrants | Argentina | 97.0 /100 | #100 | Exceptional 67.9% |
| Immigrants | Eastern Europe | 96.9 /100 | #101 | Exceptional 67.9% |