South African vs Armenian 10th Grade

COMPARE

South African
Race
Ancestry
AfghanAfricanAlaska NativeAlaskan AthabascanAlbanianAleutAlsatianAmericanApacheArabArapahoArgentineanAssyrian/Chaldean/SyriacAustralianAustrianBahamianBangladeshiBarbadianBasqueBelgianBelizeanBermudanBhutaneseBlackfeetBolivianBrazilianBritishBritish West IndianBulgarianBurmeseCajunCambodianCanadianCape VerdeanCarpatho RusynCelticCentral AmericanCentral American IndianCherokeeCheyenneChickasawChileanChineseChippewaChoctawColombianColvilleComancheCosta RicanCreeCreekCroatianCrowCubanCypriotCzechCzechoslovakianDanishDelawareDominicanDutchDutch West IndianEastern EuropeanEcuadorianEgyptianEnglishEstonianEthiopianEuropeanFijianFilipinoFinnishFrenchFrench American IndianFrench CanadianGermanGerman RussianGhanaianGreekGuamanian/ChamorroGuatemalanGuyaneseHaitianHmongHonduranHopiHoumaHungarianIcelanderIndian (Asian)IndonesianInupiatIranianIraqiIrishIroquoisIsraeliItalianJamaicanJapaneseJordanianKenyanKiowaKoreanLaotianLatvianLebaneseLiberianLithuanianLumbeeLuxembourgerMacedonianMalaysianMalteseMarshalleseMenomineeMexicanMexican American IndianMongolianMoroccanNative HawaiianNavajoNepaleseNew ZealanderNicaraguanNigerianNorthern EuropeanNorwegianOkinawanOsageOttawaPaiutePakistaniPalestinianPanamanianParaguayanPennsylvania GermanPeruvianPimaPolishPortuguesePotawatomiPuebloPuerto RicanPuget Sound SalishRomanianRussianSalvadoranSamoanScandinavianScotch-IrishScottishSeminoleSenegaleseSerbianShoshoneSierra LeoneanSiouxSlavicSlovakSloveneSomaliSouth AfricanSouth AmericanSouth American IndianSoviet UnionSpaniardSpanishSpanish AmericanSpanish American IndianSri LankanSubsaharan AfricanSudaneseSwedishSwissSyrianTaiwaneseThaiTlingit-HaidaTohono O'OdhamTonganTrinidadian and TobagonianTsimshianTurkishU.S. Virgin IslanderUgandanUkrainianUruguayanUteVenezuelanVietnameseWelshWest IndianYakamaYaquiYugoslavianYumanYup'ikZimbabwean
Immigration
NonimmigrantsImmigrantsAfghanistanAfricaAlbaniaArgentinaArmeniaAsiaAustraliaAustriaBahamasBangladeshBarbadosBelarusBelgiumBelizeBoliviaBosnia and HerzegovinaBrazilBulgariaBurma/MyanmarCabo VerdeCambodiaCameroonCanadaCaribbeanCentral AmericaChileChinaColombiaCongoCosta RicaCroatiaCubaCzechoslovakiaDenmarkDominicaDominican RepublicEastern AfricaEastern AsiaEastern EuropeEcuadorEgyptEl SalvadorEnglandEritreaEthiopiaEuropeFijiFranceGermanyGhanaGreeceGrenadaGuatemalaGuyanaHaitiHondurasHong KongHungaryIndiaIndonesiaIranIraqIrelandIsraelItalyJamaicaJapanJordanKazakhstanKenyaKoreaKuwaitLaosLatin AmericaLatviaLebanonLiberiaLithuaniaMalaysiaMexicoMicronesiaMiddle AfricaMoldovaMoroccoNepalNetherlandsNicaraguaNigeriaNorth AmericaNorth MacedoniaNorthern AfricaNorthern EuropeNorwayOceaniaPakistanPanamaPeruPhilippinesPolandPortugalRomaniaRussiaSaudi ArabiaScotlandSenegalSerbiaSierra LeoneSingaporeSomaliaSouth AfricaSouth AmericaSouth Central AsiaSouth Eastern AsiaSouthern EuropeSpainSri LankaSt. Vincent and the GrenadinesSudanSwedenSwitzerlandSyriaTaiwanThailandTrinidad and TobagoTurkeyUgandaUkraineUruguayUzbekistanVenezuelaVietnamWest IndiesWestern AfricaWestern AsiaWestern EuropeYemenZaireZimbabweAzores
Armenian
Race
Ancestry
AfghanAfricanAlaska NativeAlaskan AthabascanAlbanianAleutAlsatianAmericanApacheArabArapahoArgentineanArmenianAssyrian/Chaldean/SyriacAustralianAustrianBahamianBangladeshiBarbadianBasqueBelgianBelizeanBermudanBhutaneseBlackfeetBolivianBrazilianBritishBritish West IndianBulgarianBurmeseCajunCambodianCanadianCape VerdeanCarpatho RusynCelticCentral AmericanCentral American IndianCherokeeCheyenneChickasawChileanChineseChippewaChoctawColombianColvilleComancheCosta RicanCreeCreekCroatianCrowCubanCypriotCzechCzechoslovakianDanishDelawareDominicanDutchDutch West IndianEastern EuropeanEcuadorianEgyptianEnglishEstonianEthiopianEuropeanFijianFilipinoFinnishFrenchFrench American IndianFrench CanadianGermanGerman RussianGhanaianGreekGuamanian/ChamorroGuatemalanGuyaneseHaitianHmongHonduranHopiHoumaHungarianIcelanderIndian (Asian)IndonesianInupiatIranianIraqiIrishIroquoisIsraeliItalianJamaicanJapaneseJordanianKenyanKiowaKoreanLaotianLatvianLebaneseLiberianLithuanianLumbeeLuxembourgerMacedonianMalaysianMalteseMarshalleseMenomineeMexicanMexican American IndianMongolianMoroccanNative HawaiianNavajoNepaleseNew ZealanderNicaraguanNigerianNorthern EuropeanNorwegianOkinawanOsageOttawaPaiutePakistaniPalestinianPanamanianParaguayanPennsylvania GermanPeruvianPimaPolishPortuguesePotawatomiPuebloPuerto RicanPuget Sound SalishRomanianRussianSalvadoranSamoanScandinavianScotch-IrishScottishSeminoleSenegaleseSerbianShoshoneSierra LeoneanSiouxSlavicSlovakSloveneSomaliSouth AmericanSouth American IndianSoviet UnionSpaniardSpanishSpanish AmericanSpanish American IndianSri LankanSubsaharan AfricanSudaneseSwedishSwissSyrianTaiwaneseThaiTlingit-HaidaTohono O'OdhamTonganTrinidadian and TobagonianTsimshianTurkishU.S. Virgin IslanderUgandanUkrainianUruguayanUteVenezuelanVietnameseWelshWest IndianYakamaYaquiYugoslavianYumanYup'ikZimbabwean
Immigration
NonimmigrantsImmigrantsAfghanistanAfricaAlbaniaArgentinaArmeniaAsiaAustraliaAustriaBahamasBangladeshBarbadosBelarusBelgiumBelizeBoliviaBosnia and HerzegovinaBrazilBulgariaBurma/MyanmarCabo VerdeCambodiaCameroonCanadaCaribbeanCentral AmericaChileChinaColombiaCongoCosta RicaCroatiaCubaCzechoslovakiaDenmarkDominicaDominican RepublicEastern AfricaEastern AsiaEastern EuropeEcuadorEgyptEl SalvadorEnglandEritreaEthiopiaEuropeFijiFranceGermanyGhanaGreeceGrenadaGuatemalaGuyanaHaitiHondurasHong KongHungaryIndiaIndonesiaIranIraqIrelandIsraelItalyJamaicaJapanJordanKazakhstanKenyaKoreaKuwaitLaosLatin AmericaLatviaLebanonLiberiaLithuaniaMalaysiaMexicoMicronesiaMiddle AfricaMoldovaMoroccoNepalNetherlandsNicaraguaNigeriaNorth AmericaNorth MacedoniaNorthern AfricaNorthern EuropeNorwayOceaniaPakistanPanamaPeruPhilippinesPolandPortugalRomaniaRussiaSaudi ArabiaScotlandSenegalSerbiaSierra LeoneSingaporeSomaliaSouth AfricaSouth AmericaSouth Central AsiaSouth Eastern AsiaSouthern EuropeSpainSri LankaSt. Vincent and the GrenadinesSudanSwedenSwitzerlandSyriaTaiwanThailandTrinidad and TobagoTurkeyUgandaUkraineUruguayUzbekistanVenezuelaVietnamWest IndiesWestern AfricaWestern AsiaWestern EuropeYemenZaireZimbabweAzores
10th Grade
Income
Poverty
Unemployment
Labor Participation
Family Structure
Vehicle Availability
Education Level
Disability

10th Grade Comparison

South Africans

Armenians

Exceptional
Tragic
94.7%
10TH GRADE
98.8/ 100
METRIC RATING
90th/ 347
METRIC RANK
92.7%
10TH GRADE
0.9/ 100
METRIC RATING
254th/ 347
METRIC RANK

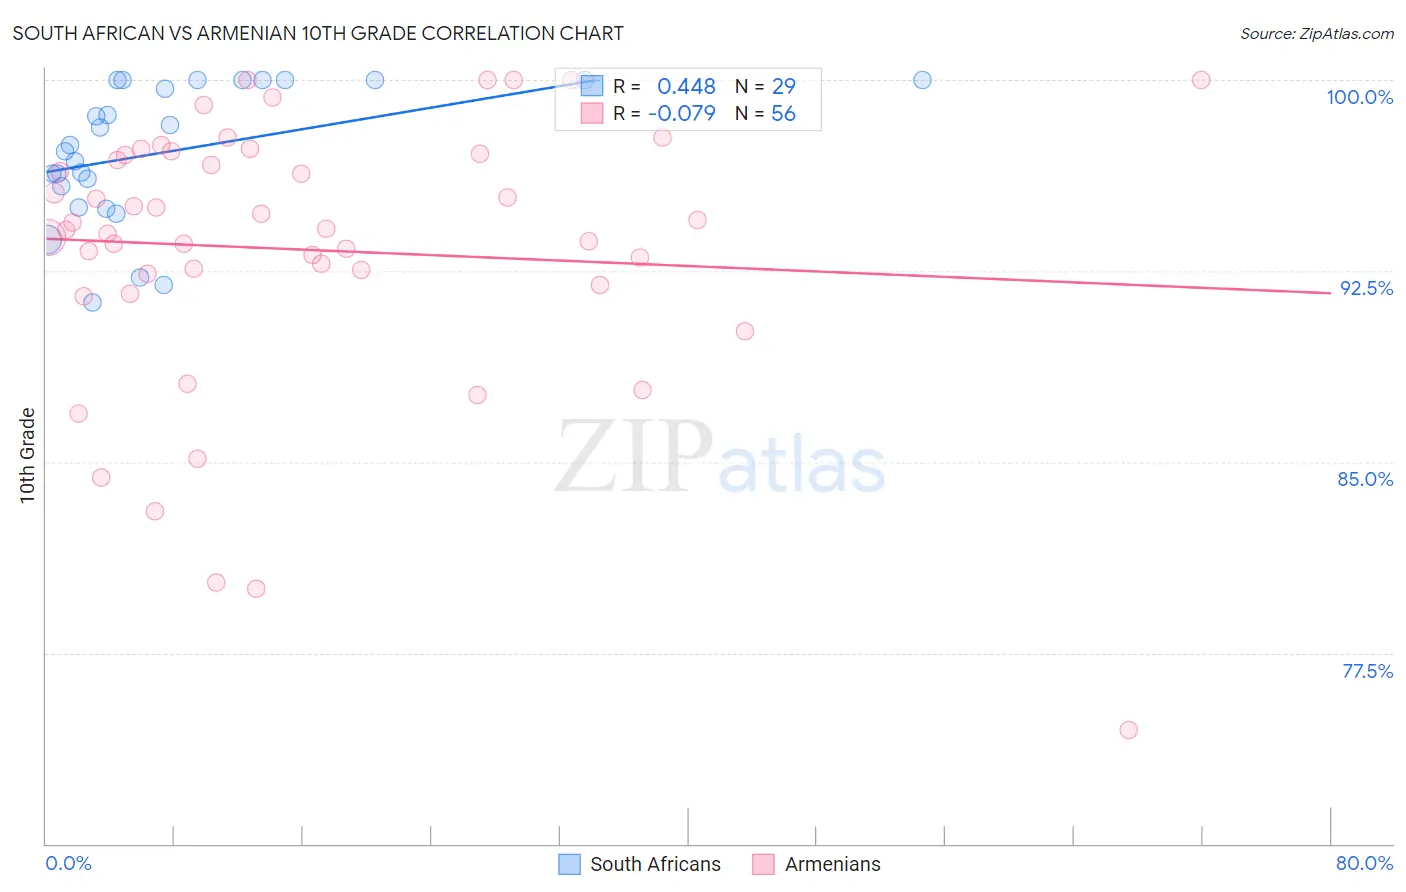
South African vs Armenian 10th Grade Correlation Chart

The statistical analysis conducted on geographies consisting of 182,604,532 people shows a moderate positive correlation between the proportion of South Africans and percentage of population with at least 10th grade education in the United States with a correlation coefficient (R) of 0.448 and weighted average of 94.7%. Similarly, the statistical analysis conducted on geographies consisting of 310,954,685 people shows a slight negative correlation between the proportion of Armenians and percentage of population with at least 10th grade education in the United States with a correlation coefficient (R) of -0.079 and weighted average of 92.7%, a difference of 2.1%.
South African vs Armenian 10th Grade

10th Grade Correlation Summary

MeasurementSouth AfricanArmenian
Minimum91.3%74.5%
Maximum100.0%100.0%
Range8.7%25.5%
Mean97.2%93.3%
Median97.5%94.1%
Interquartile 25% (IQ1)95.4%92.2%
Interquartile 75% (IQ3)100.0%97.1%
Interquartile Range (IQR)4.6%4.9%
Standard Deviation (Sample)2.7%5.4%
Standard Deviation (Population)2.6%5.3%

Similar Demographics by 10th Grade

Demographics Similar to South Africans by 10th Grade

In terms of 10th grade, the demographic groups most similar to South Africans are Immigrants from Moldova (94.7%, a difference of 0.010%), White/Caucasian (94.7%, a difference of 0.010%), Immigrants from Japan (94.7%, a difference of 0.020%), Immigrants from Saudi Arabia (94.7%, a difference of 0.030%), and Crow (94.7%, a difference of 0.040%).
DemographicsRating | Rank10th Grade
Immigrants | Western Europe
99.1
/100
|
#83
Exceptional
94.7%
Icelanders
99.1
/100
|
#84
Exceptional
94.7%
Crow
99.0
/100
|
#85
Exceptional
94.7%
Puget Sound Salish
99.0
/100
|
#86
Exceptional
94.7%
Immigrants | Saudi Arabia
99.0
/100
|
#87
Exceptional
94.7%
Immigrants | Japan
99.0
/100
|
#88
Exceptional
94.7%
Immigrants | Moldova
98.9
/100
|
#89
Exceptional
94.7%
South Africans
98.8
/100
|
#90
Exceptional
94.7%
Whites/Caucasians
98.8
/100
|
#91
Exceptional
94.7%
Yugoslavians
98.4
/100
|
#92
Exceptional
94.6%
Soviet Union
98.3
/100
|
#93
Exceptional
94.6%
Immigrants | Germany
98.3
/100
|
#94
Exceptional
94.6%
Menominee
98.3
/100
|
#95
Exceptional
94.6%
Immigrants | Switzerland
98.3
/100
|
#96
Exceptional
94.6%
Lebanese
98.3
/100
|
#97
Exceptional
94.6%

Demographics Similar to Armenians by 10th Grade

In terms of 10th grade, the demographic groups most similar to Armenians are South American (92.8%, a difference of 0.010%), Ghanaian (92.8%, a difference of 0.010%), Immigrants from Thailand (92.8%, a difference of 0.020%), Immigrants from Bolivia (92.7%, a difference of 0.050%), and Immigrants from Nigeria (92.7%, a difference of 0.060%).
DemographicsRating | Rank10th Grade
Immigrants | Afghanistan
1.4
/100
|
#247
Tragic
92.8%
Colombians
1.4
/100
|
#248
Tragic
92.8%
Immigrants | Senegal
1.4
/100
|
#249
Tragic
92.8%
Jamaicans
1.2
/100
|
#250
Tragic
92.8%
Immigrants | Thailand
1.0
/100
|
#251
Tragic
92.8%
South Americans
0.9
/100
|
#252
Tragic
92.8%
Ghanaians
0.9
/100
|
#253
Tragic
92.8%
Armenians
0.9
/100
|
#254
Tragic
92.7%
Immigrants | Bolivia
0.7
/100
|
#255
Tragic
92.7%
Immigrants | Nigeria
0.7
/100
|
#256
Tragic
92.7%
U.S. Virgin Islanders
0.7
/100
|
#257
Tragic
92.7%
Immigrants | Costa Rica
0.6
/100
|
#258
Tragic
92.7%
Immigrants | Jamaica
0.5
/100
|
#259
Tragic
92.6%
Immigrants | Uzbekistan
0.5
/100
|
#260
Tragic
92.6%
Paiute
0.4
/100
|
#261
Tragic
92.6%