Somali vs Dominican Female Disability
COMPARE
Somali
Dominican
Female Disability
Female Disability Comparison
Somalis
Dominicans
12.3%
FEMALE DISABILITY
21.5/ 100
METRIC RATING
202nd/ 347
METRIC RANK
13.5%
FEMALE DISABILITY
0.0/ 100
METRIC RATING
305th/ 347
METRIC RANK
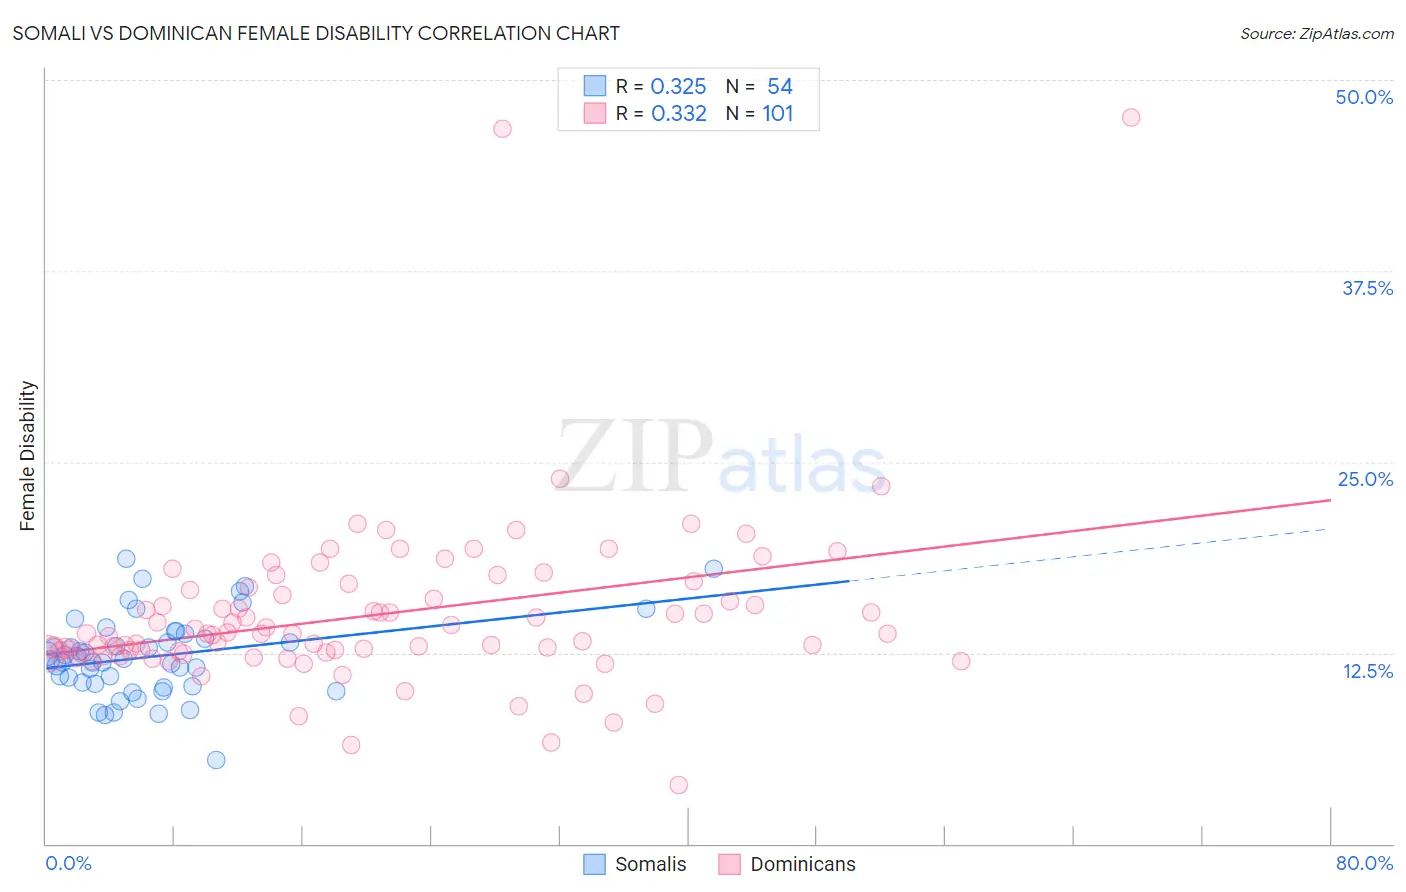
Somali vs Dominican Female Disability Correlation Chart
The statistical analysis conducted on geographies consisting of 99,314,959 people shows a mild positive correlation between the proportion of Somalis and percentage of females with a disability in the United States with a correlation coefficient (R) of 0.325 and weighted average of 12.3%. Similarly, the statistical analysis conducted on geographies consisting of 355,036,976 people shows a mild positive correlation between the proportion of Dominicans and percentage of females with a disability in the United States with a correlation coefficient (R) of 0.332 and weighted average of 13.5%, a difference of 9.3%.
Female Disability Correlation Summary
| Measurement | Somali | Dominican |
| Minimum | 5.5% | 3.9% |
| Maximum | 18.6% | 47.5% |
| Range | 13.1% | 43.7% |
| Mean | 12.3% | 15.0% |
| Median | 12.1% | 13.8% |
| Interquartile 25% (IQ1) | 10.5% | 12.5% |
| Interquartile 75% (IQ3) | 13.7% | 16.7% |
| Interquartile Range (IQR) | 3.3% | 4.2% |
| Standard Deviation (Sample) | 2.7% | 5.8% |
| Standard Deviation (Population) | 2.6% | 5.7% |
Similar Demographics by Female Disability
Demographics Similar to Somalis by Female Disability
In terms of female disability, the demographic groups most similar to Somalis are Immigrants from Barbados (12.3%, a difference of 0.020%), Chinese (12.3%, a difference of 0.030%), Trinidadian and Tobagonian (12.3%, a difference of 0.040%), Immigrants from Zaire (12.3%, a difference of 0.040%), and Immigrants from Grenada (12.4%, a difference of 0.060%).
| Demographics | Rating | Rank | Female Disability |
| Swedes | 26.6 /100 | #195 | Fair 12.3% |
| Immigrants | Panama | 25.5 /100 | #196 | Fair 12.3% |
| Hondurans | 25.4 /100 | #197 | Fair 12.3% |
| Mexican American Indians | 24.9 /100 | #198 | Fair 12.3% |
| Immigrants | Trinidad and Tobago | 24.7 /100 | #199 | Fair 12.3% |
| Trinidadians and Tobagonians | 22.4 /100 | #200 | Fair 12.3% |
| Chinese | 22.1 /100 | #201 | Fair 12.3% |
| Somalis | 21.5 /100 | #202 | Fair 12.3% |
| Immigrants | Barbados | 21.1 /100 | #203 | Fair 12.3% |
| Immigrants | Zaire | 20.9 /100 | #204 | Fair 12.3% |
| Immigrants | Grenada | 20.5 /100 | #205 | Fair 12.4% |
| Immigrants | Cuba | 20.2 /100 | #206 | Fair 12.4% |
| Croatians | 20.2 /100 | #207 | Fair 12.4% |
| Basques | 17.5 /100 | #208 | Poor 12.4% |
| Mexicans | 15.7 /100 | #209 | Poor 12.4% |
Demographics Similar to Dominicans by Female Disability
In terms of female disability, the demographic groups most similar to Dominicans are Immigrants from Micronesia (13.5%, a difference of 0.31%), Immigrants from Portugal (13.5%, a difference of 0.34%), Scotch-Irish (13.4%, a difference of 0.35%), African (13.4%, a difference of 0.48%), and French Canadian (13.6%, a difference of 0.63%).
| Demographics | Rating | Rank | Female Disability |
| Immigrants | Nonimmigrants | 0.0 /100 | #298 | Tragic 13.4% |
| Immigrants | Dominican Republic | 0.0 /100 | #299 | Tragic 13.4% |
| Pennsylvania Germans | 0.0 /100 | #300 | Tragic 13.4% |
| Africans | 0.0 /100 | #301 | Tragic 13.4% |
| Scotch-Irish | 0.0 /100 | #302 | Tragic 13.4% |
| Immigrants | Portugal | 0.0 /100 | #303 | Tragic 13.5% |
| Immigrants | Micronesia | 0.0 /100 | #304 | Tragic 13.5% |
| Dominicans | 0.0 /100 | #305 | Tragic 13.5% |
| French Canadians | 0.0 /100 | #306 | Tragic 13.6% |
| Central American Indians | 0.0 /100 | #307 | Tragic 13.6% |
| Cree | 0.0 /100 | #308 | Tragic 13.7% |
| French American Indians | 0.0 /100 | #309 | Tragic 13.7% |
| Apache | 0.0 /100 | #310 | Tragic 13.7% |
| Hopi | 0.0 /100 | #311 | Tragic 13.7% |
| Delaware | 0.0 /100 | #312 | Tragic 13.8% |