Slovene vs Immigrants from Korea College, 1 year or more
COMPARE
Slovene
Immigrants from Korea
College, 1 year or more
College, 1 year or more Comparison
Slovenes
Immigrants from Korea
60.9%
COLLEGE, 1 YEAR OR MORE
86.5/ 100
METRIC RATING
137th/ 347
METRIC RANK
66.5%
COLLEGE, 1 YEAR OR MORE
100.0/ 100
METRIC RATING
20th/ 347
METRIC RANK
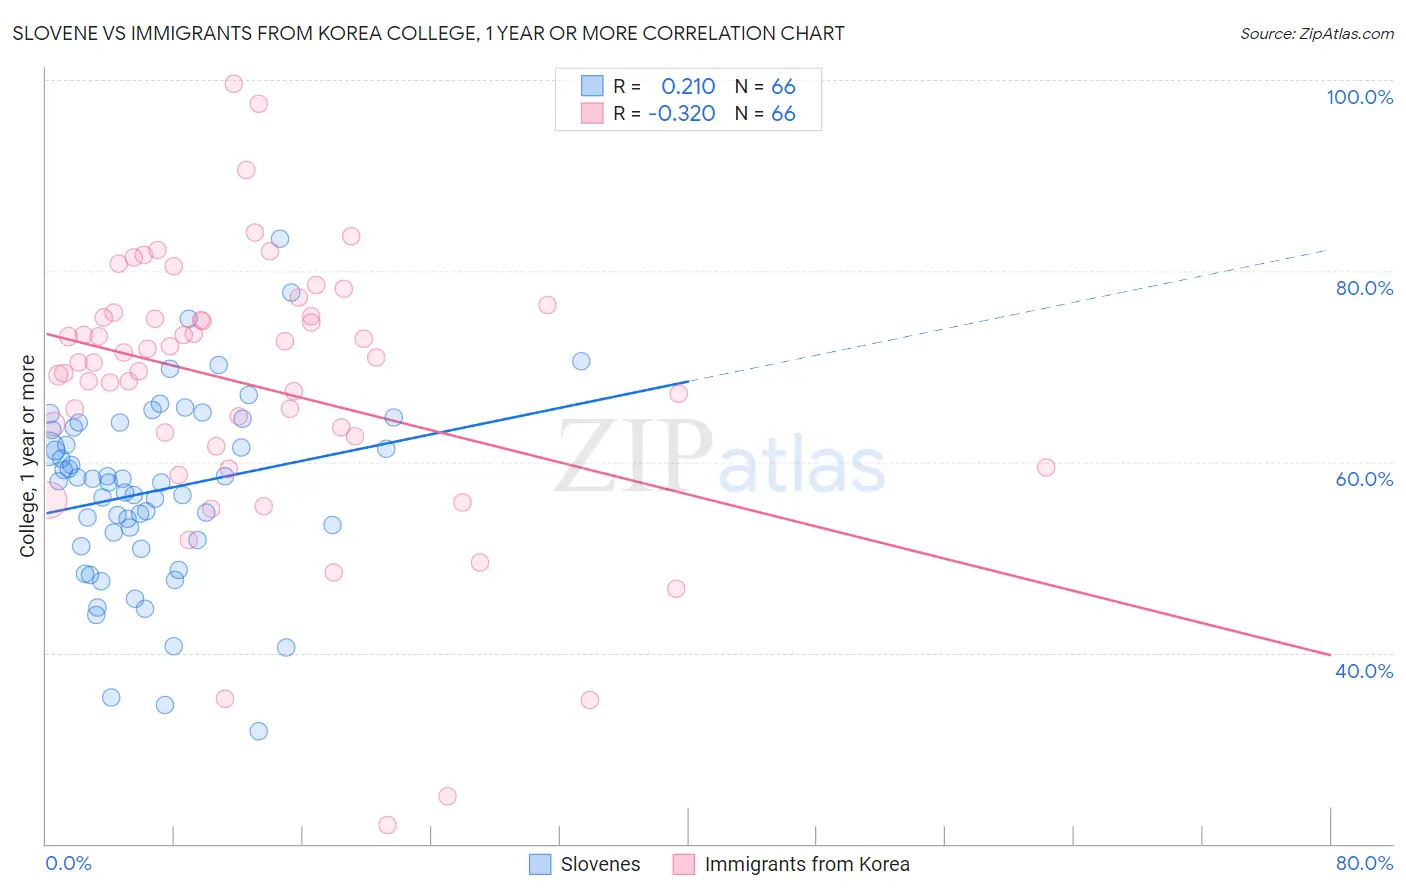
Slovene vs Immigrants from Korea College, 1 year or more Correlation Chart
The statistical analysis conducted on geographies consisting of 261,353,489 people shows a weak positive correlation between the proportion of Slovenes and percentage of population with at least college, 1 year or more education in the United States with a correlation coefficient (R) of 0.210 and weighted average of 60.9%. Similarly, the statistical analysis conducted on geographies consisting of 416,335,693 people shows a mild negative correlation between the proportion of Immigrants from Korea and percentage of population with at least college, 1 year or more education in the United States with a correlation coefficient (R) of -0.320 and weighted average of 66.5%, a difference of 9.2%.
College, 1 year or more Correlation Summary
| Measurement | Slovene | Immigrants from Korea |
| Minimum | 31.8% | 22.0% |
| Maximum | 83.3% | 99.6% |
| Range | 51.5% | 77.6% |
| Mean | 57.0% | 68.0% |
| Median | 57.9% | 70.7% |
| Interquartile 25% (IQ1) | 51.8% | 62.6% |
| Interquartile 75% (IQ3) | 63.6% | 75.2% |
| Interquartile Range (IQR) | 11.8% | 12.6% |
| Standard Deviation (Sample) | 9.8% | 14.4% |
| Standard Deviation (Population) | 9.7% | 14.3% |
Similar Demographics by College, 1 year or more
Demographics Similar to Slovenes by College, 1 year or more
In terms of college, 1 year or more, the demographic groups most similar to Slovenes are Basque (60.9%, a difference of 0.090%), Immigrants from Uganda (60.9%, a difference of 0.11%), Immigrants from Venezuela (61.0%, a difference of 0.16%), Immigrants from Uzbekistan (61.0%, a difference of 0.18%), and Scandinavian (61.0%, a difference of 0.20%).
| Demographics | Rating | Rank | College, 1 year or more |
| Italians | 89.5 /100 | #130 | Excellent 61.1% |
| Immigrants | Morocco | 89.5 /100 | #131 | Excellent 61.1% |
| Scandinavians | 88.2 /100 | #132 | Excellent 61.0% |
| Immigrants | Uzbekistan | 88.0 /100 | #133 | Excellent 61.0% |
| Immigrants | Venezuela | 87.9 /100 | #134 | Excellent 61.0% |
| Immigrants | Uganda | 87.4 /100 | #135 | Excellent 60.9% |
| Basques | 87.2 /100 | #136 | Excellent 60.9% |
| Slovenes | 86.5 /100 | #137 | Excellent 60.9% |
| Taiwanese | 84.3 /100 | #138 | Excellent 60.7% |
| Immigrants | Eritrea | 84.3 /100 | #139 | Excellent 60.7% |
| Iraqis | 83.3 /100 | #140 | Excellent 60.7% |
| Immigrants | Afghanistan | 83.1 /100 | #141 | Excellent 60.7% |
| Poles | 82.8 /100 | #142 | Excellent 60.7% |
| Canadians | 82.7 /100 | #143 | Excellent 60.6% |
| Czechs | 81.9 /100 | #144 | Excellent 60.6% |
Demographics Similar to Immigrants from Korea by College, 1 year or more
In terms of college, 1 year or more, the demographic groups most similar to Immigrants from Korea are Immigrants from Switzerland (66.5%, a difference of 0.040%), Immigrants from Hong Kong (66.4%, a difference of 0.070%), Eastern European (66.6%, a difference of 0.090%), Soviet Union (66.4%, a difference of 0.13%), and Immigrants from Eastern Asia (66.6%, a difference of 0.17%).
| Demographics | Rating | Rank | College, 1 year or more |
| Immigrants | Sweden | 100.0 /100 | #13 | Exceptional 66.8% |
| Burmese | 100.0 /100 | #14 | Exceptional 66.7% |
| Cambodians | 100.0 /100 | #15 | Exceptional 66.7% |
| Immigrants | Japan | 100.0 /100 | #16 | Exceptional 66.7% |
| Immigrants | Eastern Asia | 100.0 /100 | #17 | Exceptional 66.6% |
| Eastern Europeans | 100.0 /100 | #18 | Exceptional 66.6% |
| Immigrants | Switzerland | 100.0 /100 | #19 | Exceptional 66.5% |
| Immigrants | Korea | 100.0 /100 | #20 | Exceptional 66.5% |
| Immigrants | Hong Kong | 100.0 /100 | #21 | Exceptional 66.4% |
| Soviet Union | 100.0 /100 | #22 | Exceptional 66.4% |
| Immigrants | China | 100.0 /100 | #23 | Exceptional 66.4% |
| Immigrants | Belgium | 100.0 /100 | #24 | Exceptional 66.3% |
| Indians (Asian) | 100.0 /100 | #25 | Exceptional 66.1% |
| Latvians | 100.0 /100 | #26 | Exceptional 66.1% |
| Immigrants | Ireland | 100.0 /100 | #27 | Exceptional 65.9% |