Slovene vs Luxembourger Family Households
COMPARE
Slovene
Luxembourger
Family Households
Family Households Comparison
Slovenes
Luxembourgers
62.4%
FAMILY HOUSEHOLDS
0.0/ 100
METRIC RATING
296th/ 347
METRIC RANK
63.3%
FAMILY HOUSEHOLDS
0.9/ 100
METRIC RATING
256th/ 347
METRIC RANK
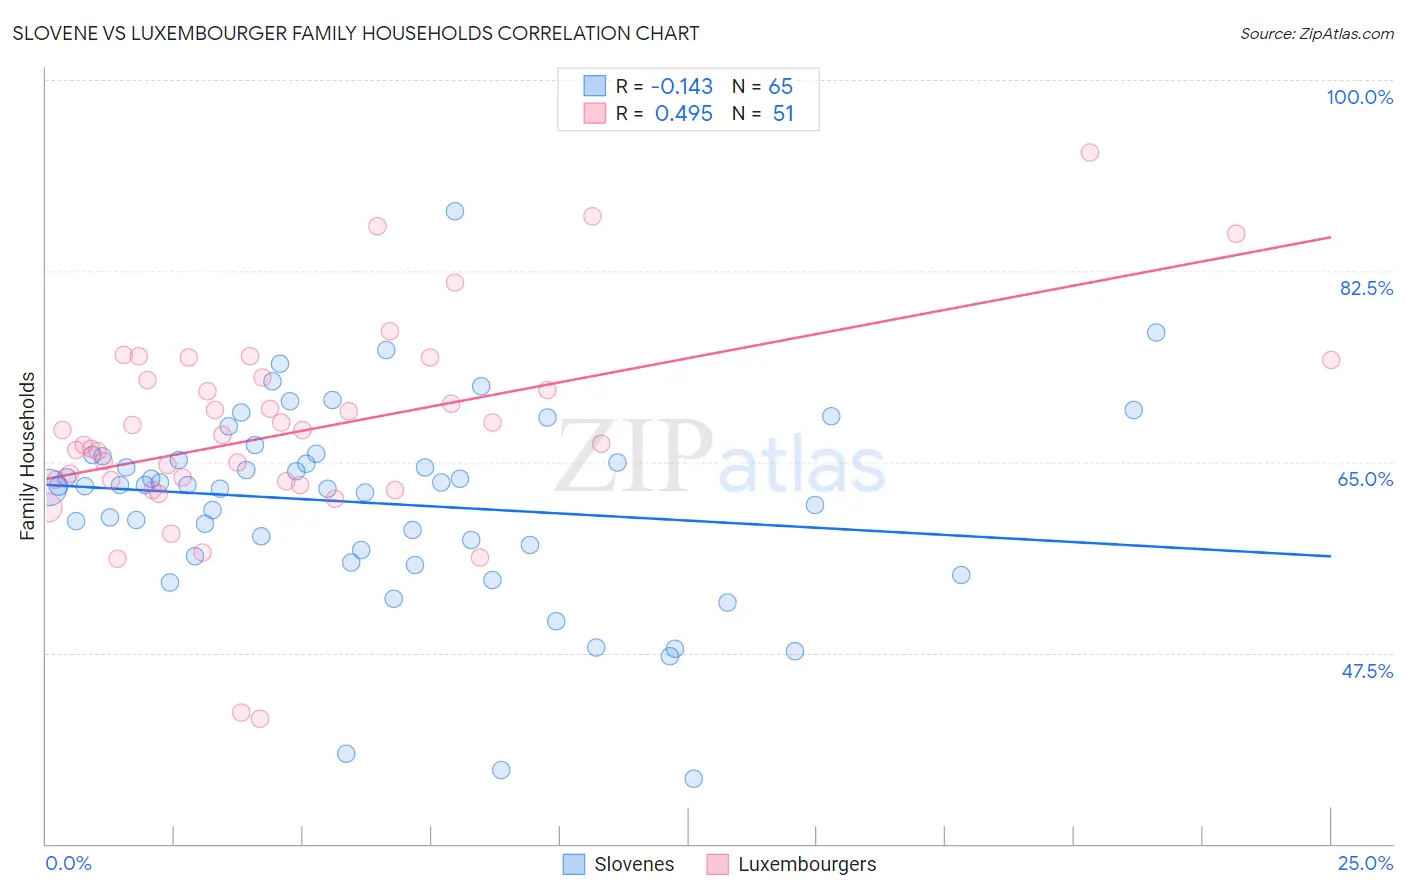
Slovene vs Luxembourger Family Households Correlation Chart
The statistical analysis conducted on geographies consisting of 261,256,985 people shows a poor negative correlation between the proportion of Slovenes and percentage of family households in the United States with a correlation coefficient (R) of -0.143 and weighted average of 62.4%. Similarly, the statistical analysis conducted on geographies consisting of 144,654,456 people shows a moderate positive correlation between the proportion of Luxembourgers and percentage of family households in the United States with a correlation coefficient (R) of 0.495 and weighted average of 63.3%, a difference of 1.3%.
Family Households Correlation Summary
| Measurement | Slovene | Luxembourger |
| Minimum | 35.9% | 41.4% |
| Maximum | 88.0% | 93.3% |
| Range | 52.0% | 51.9% |
| Mean | 61.2% | 67.9% |
| Median | 62.8% | 67.5% |
| Interquartile 25% (IQ1) | 56.6% | 63.2% |
| Interquartile 75% (IQ3) | 65.5% | 72.7% |
| Interquartile Range (IQR) | 9.0% | 9.5% |
| Standard Deviation (Sample) | 9.1% | 9.5% |
| Standard Deviation (Population) | 9.1% | 9.4% |
Similar Demographics by Family Households
Demographics Similar to Slovenes by Family Households
In terms of family households, the demographic groups most similar to Slovenes are Okinawan (62.5%, a difference of 0.010%), French American Indian (62.4%, a difference of 0.010%), Barbadian (62.5%, a difference of 0.020%), Immigrants from Spain (62.4%, a difference of 0.040%), and Immigrants from Sweden (62.5%, a difference of 0.090%).
| Demographics | Rating | Rank | Family Households |
| Immigrants | Nepal | 0.1 /100 | #289 | Tragic 62.7% |
| Immigrants | Grenada | 0.0 /100 | #290 | Tragic 62.6% |
| U.S. Virgin Islanders | 0.0 /100 | #291 | Tragic 62.6% |
| Immigrants | Burma/Myanmar | 0.0 /100 | #292 | Tragic 62.6% |
| Immigrants | Sweden | 0.0 /100 | #293 | Tragic 62.5% |
| Barbadians | 0.0 /100 | #294 | Tragic 62.5% |
| Okinawans | 0.0 /100 | #295 | Tragic 62.5% |
| Slovenes | 0.0 /100 | #296 | Tragic 62.4% |
| French American Indians | 0.0 /100 | #297 | Tragic 62.4% |
| Immigrants | Spain | 0.0 /100 | #298 | Tragic 62.4% |
| Immigrants | Kuwait | 0.0 /100 | #299 | Tragic 62.4% |
| Immigrants | Africa | 0.0 /100 | #300 | Tragic 62.4% |
| Immigrants | Albania | 0.0 /100 | #301 | Tragic 62.4% |
| Immigrants | Kenya | 0.0 /100 | #302 | Tragic 62.3% |
| Cree | 0.0 /100 | #303 | Tragic 62.3% |
Demographics Similar to Luxembourgers by Family Households
In terms of family households, the demographic groups most similar to Luxembourgers are Potawatomi (63.3%, a difference of 0.020%), Icelander (63.3%, a difference of 0.040%), Immigrants from Dominican Republic (63.3%, a difference of 0.050%), Slovak (63.3%, a difference of 0.050%), and Bahamian (63.3%, a difference of 0.080%).
| Demographics | Rating | Rank | Family Households |
| Russians | 1.4 /100 | #249 | Tragic 63.4% |
| Immigrants | Japan | 1.4 /100 | #250 | Tragic 63.4% |
| Taiwanese | 1.2 /100 | #251 | Tragic 63.3% |
| Bahamians | 1.1 /100 | #252 | Tragic 63.3% |
| Immigrants | Dominican Republic | 1.0 /100 | #253 | Tragic 63.3% |
| Slovaks | 1.0 /100 | #254 | Tragic 63.3% |
| Potawatomi | 1.0 /100 | #255 | Tragic 63.3% |
| Luxembourgers | 0.9 /100 | #256 | Tragic 63.3% |
| Icelanders | 0.8 /100 | #257 | Tragic 63.3% |
| Immigrants | Barbados | 0.7 /100 | #258 | Tragic 63.2% |
| Immigrants | Western Europe | 0.6 /100 | #259 | Tragic 63.2% |
| Cypriots | 0.6 /100 | #260 | Tragic 63.2% |
| Immigrants | Russia | 0.6 /100 | #261 | Tragic 63.2% |
| Immigrants | Ireland | 0.6 /100 | #262 | Tragic 63.2% |
| Cheyenne | 0.5 /100 | #263 | Tragic 63.2% |