Slovene vs Welsh College, 1 year or more
COMPARE
Slovene
Welsh
College, 1 year or more
College, 1 year or more Comparison
Slovenes
Welsh
60.9%
COLLEGE, 1 YEAR OR MORE
86.5/ 100
METRIC RATING
137th/ 347
METRIC RANK
59.5%
COLLEGE, 1 YEAR OR MORE
52.4/ 100
METRIC RATING
170th/ 347
METRIC RANK
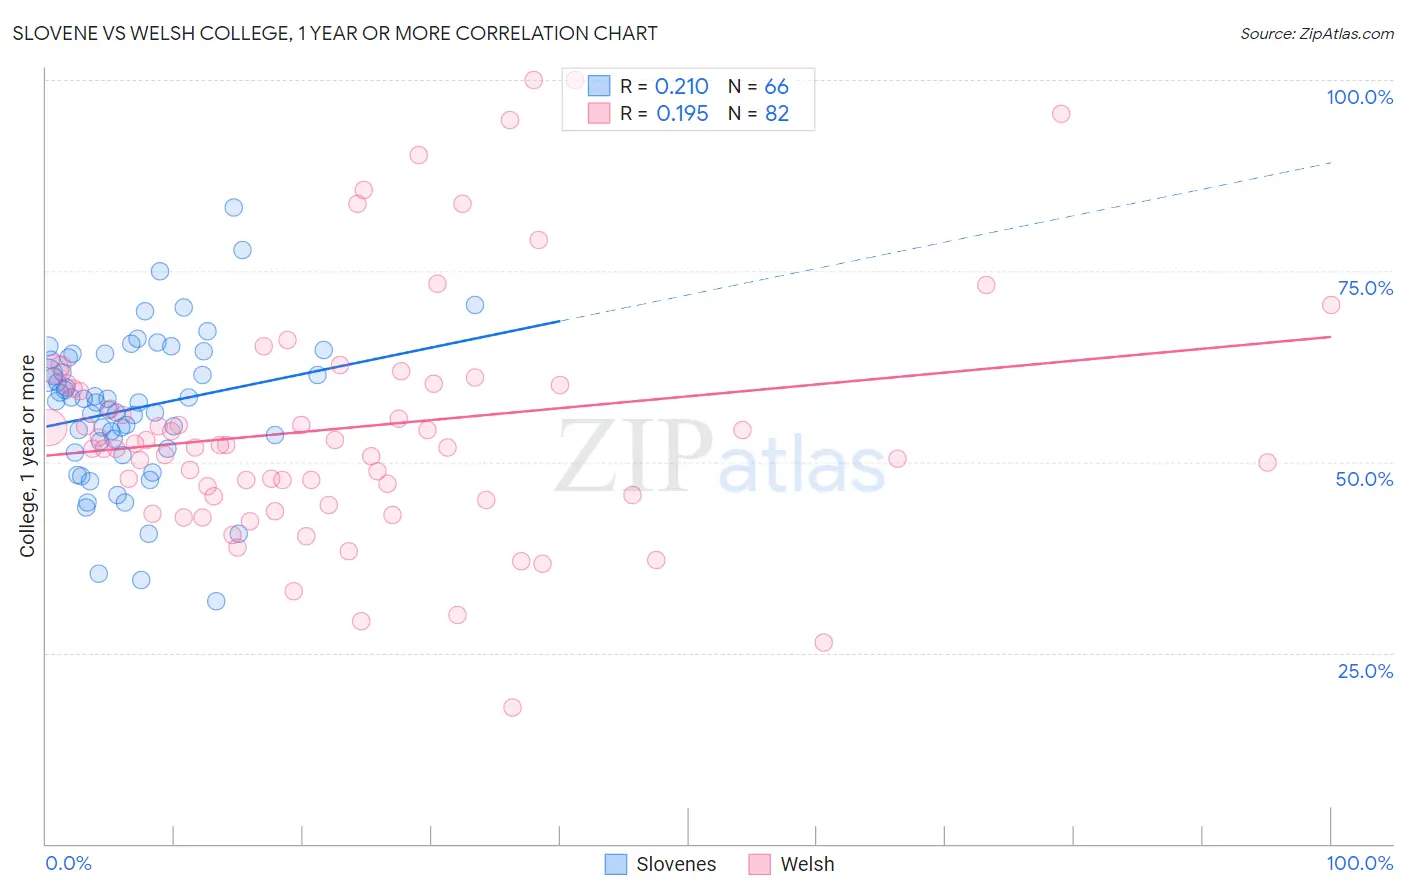
Slovene vs Welsh College, 1 year or more Correlation Chart
The statistical analysis conducted on geographies consisting of 261,353,489 people shows a weak positive correlation between the proportion of Slovenes and percentage of population with at least college, 1 year or more education in the United States with a correlation coefficient (R) of 0.210 and weighted average of 60.9%. Similarly, the statistical analysis conducted on geographies consisting of 528,593,707 people shows a poor positive correlation between the proportion of Welsh and percentage of population with at least college, 1 year or more education in the United States with a correlation coefficient (R) of 0.195 and weighted average of 59.5%, a difference of 2.3%.
College, 1 year or more Correlation Summary
| Measurement | Slovene | Welsh |
| Minimum | 31.8% | 17.8% |
| Maximum | 83.3% | 100.0% |
| Range | 51.5% | 82.2% |
| Mean | 57.0% | 54.6% |
| Median | 57.9% | 52.1% |
| Interquartile 25% (IQ1) | 51.8% | 45.5% |
| Interquartile 75% (IQ3) | 63.6% | 60.2% |
| Interquartile Range (IQR) | 11.8% | 14.7% |
| Standard Deviation (Sample) | 9.8% | 16.1% |
| Standard Deviation (Population) | 9.7% | 16.0% |
Similar Demographics by College, 1 year or more
Demographics Similar to Slovenes by College, 1 year or more
In terms of college, 1 year or more, the demographic groups most similar to Slovenes are Basque (60.9%, a difference of 0.090%), Immigrants from Uganda (60.9%, a difference of 0.11%), Immigrants from Venezuela (61.0%, a difference of 0.16%), Immigrants from Uzbekistan (61.0%, a difference of 0.18%), and Scandinavian (61.0%, a difference of 0.20%).
| Demographics | Rating | Rank | College, 1 year or more |
| Italians | 89.5 /100 | #130 | Excellent 61.1% |
| Immigrants | Morocco | 89.5 /100 | #131 | Excellent 61.1% |
| Scandinavians | 88.2 /100 | #132 | Excellent 61.0% |
| Immigrants | Uzbekistan | 88.0 /100 | #133 | Excellent 61.0% |
| Immigrants | Venezuela | 87.9 /100 | #134 | Excellent 61.0% |
| Immigrants | Uganda | 87.4 /100 | #135 | Excellent 60.9% |
| Basques | 87.2 /100 | #136 | Excellent 60.9% |
| Slovenes | 86.5 /100 | #137 | Excellent 60.9% |
| Taiwanese | 84.3 /100 | #138 | Excellent 60.7% |
| Immigrants | Eritrea | 84.3 /100 | #139 | Excellent 60.7% |
| Iraqis | 83.3 /100 | #140 | Excellent 60.7% |
| Immigrants | Afghanistan | 83.1 /100 | #141 | Excellent 60.7% |
| Poles | 82.8 /100 | #142 | Excellent 60.7% |
| Canadians | 82.7 /100 | #143 | Excellent 60.6% |
| Czechs | 81.9 /100 | #144 | Excellent 60.6% |
Demographics Similar to Welsh by College, 1 year or more
In terms of college, 1 year or more, the demographic groups most similar to Welsh are Immigrants from Albania (59.5%, a difference of 0.0%), Immigrants from Sierra Leone (59.5%, a difference of 0.010%), Immigrants from Southern Europe (59.5%, a difference of 0.020%), Hungarian (59.5%, a difference of 0.030%), and Immigrants from North Macedonia (59.5%, a difference of 0.040%).
| Demographics | Rating | Rank | College, 1 year or more |
| Immigrants | Somalia | 58.3 /100 | #163 | Average 59.7% |
| Belgians | 58.1 /100 | #164 | Average 59.7% |
| Irish | 56.1 /100 | #165 | Average 59.6% |
| Immigrants | Africa | 56.1 /100 | #166 | Average 59.6% |
| Immigrants | North Macedonia | 53.1 /100 | #167 | Average 59.5% |
| Hungarians | 52.9 /100 | #168 | Average 59.5% |
| Immigrants | Southern Europe | 52.7 /100 | #169 | Average 59.5% |
| Welsh | 52.4 /100 | #170 | Average 59.5% |
| Immigrants | Albania | 52.3 /100 | #171 | Average 59.5% |
| Immigrants | Sierra Leone | 52.2 /100 | #172 | Average 59.5% |
| Immigrants | Oceania | 51.2 /100 | #173 | Average 59.4% |
| Celtics | 50.0 /100 | #174 | Average 59.4% |
| Sri Lankans | 49.0 /100 | #175 | Average 59.4% |
| Immigrants | Poland | 48.9 /100 | #176 | Average 59.4% |
| Tlingit-Haida | 48.4 /100 | #177 | Average 59.4% |