Slavic vs Immigrants from Australia No Schooling Completed
COMPARE
Slavic
Immigrants from Australia
No Schooling Completed
No Schooling Completed Comparison
Slavs
Immigrants from Australia
1.7%
NO SCHOOLING COMPLETED
99.8/ 100
METRIC RATING
59th/ 347
METRIC RANK
1.7%
NO SCHOOLING COMPLETED
99.2/ 100
METRIC RATING
85th/ 347
METRIC RANK
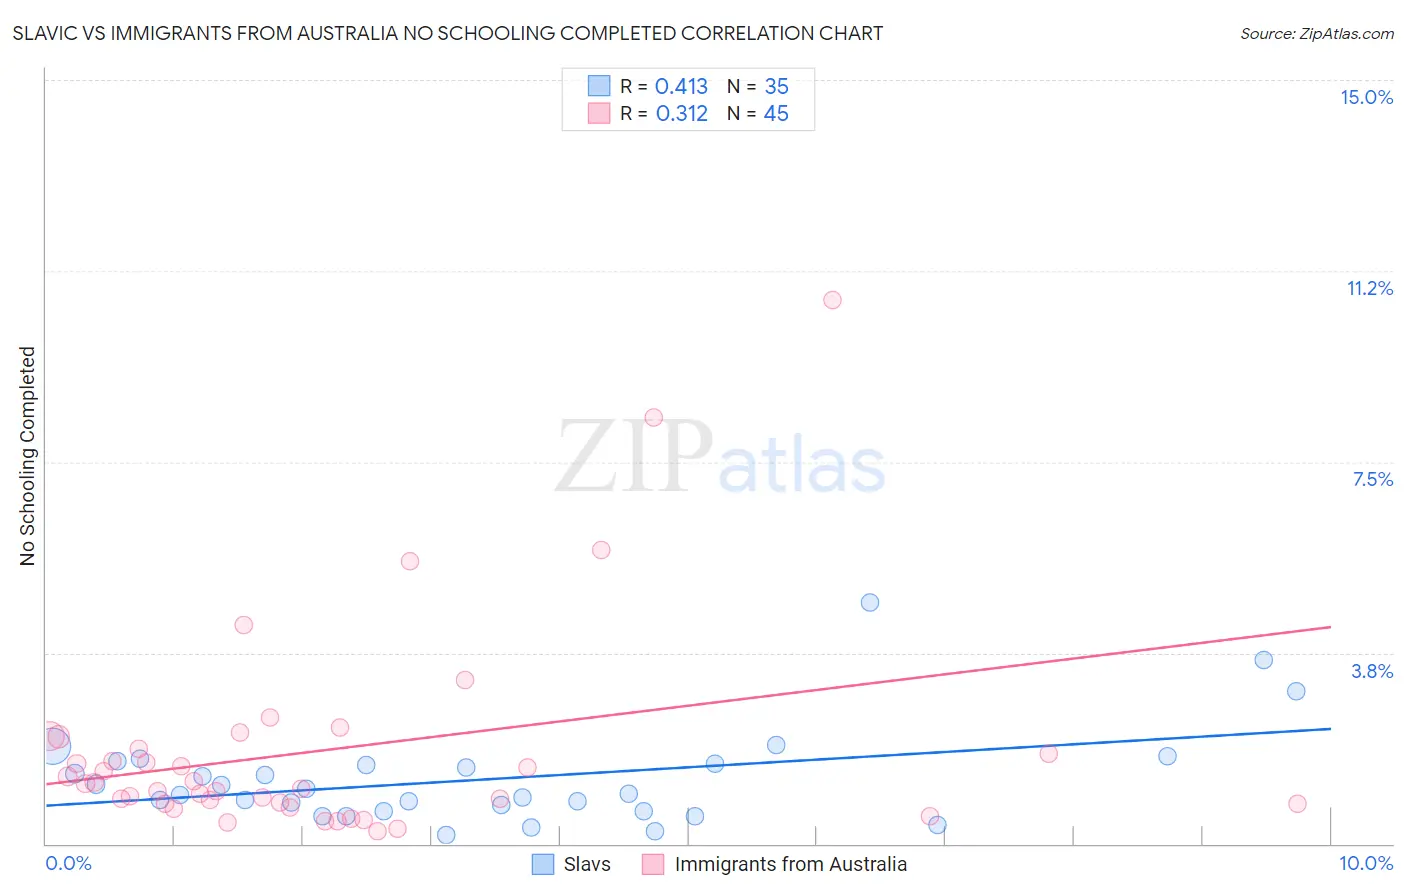
Slavic vs Immigrants from Australia No Schooling Completed Correlation Chart
The statistical analysis conducted on geographies consisting of 268,525,041 people shows a moderate positive correlation between the proportion of Slavs and percentage of population with no schooling in the United States with a correlation coefficient (R) of 0.413 and weighted average of 1.7%. Similarly, the statistical analysis conducted on geographies consisting of 225,255,511 people shows a mild positive correlation between the proportion of Immigrants from Australia and percentage of population with no schooling in the United States with a correlation coefficient (R) of 0.312 and weighted average of 1.7%, a difference of 6.0%.
No Schooling Completed Correlation Summary
| Measurement | Slavic | Immigrants from Australia |
| Minimum | 0.17% | 0.24% |
| Maximum | 4.7% | 10.7% |
| Range | 4.6% | 10.4% |
| Mean | 1.3% | 1.8% |
| Median | 0.98% | 1.2% |
| Interquartile 25% (IQ1) | 0.64% | 0.79% |
| Interquartile 75% (IQ3) | 1.6% | 2.0% |
| Interquartile Range (IQR) | 0.93% | 1.2% |
| Standard Deviation (Sample) | 0.94% | 2.1% |
| Standard Deviation (Population) | 0.93% | 2.1% |
Similar Demographics by No Schooling Completed
Demographics Similar to Slavs by No Schooling Completed
In terms of no schooling completed, the demographic groups most similar to Slavs are Kiowa (1.6%, a difference of 0.070%), American (1.7%, a difference of 0.12%), Austrian (1.6%, a difference of 0.23%), Tsimshian (1.7%, a difference of 0.42%), and Greek (1.6%, a difference of 0.54%).
| Demographics | Rating | Rank | No Schooling Completed |
| Immigrants | Canada | 99.8 /100 | #52 | Exceptional 1.6% |
| Creek | 99.8 /100 | #53 | Exceptional 1.6% |
| Crow | 99.8 /100 | #54 | Exceptional 1.6% |
| Greeks | 99.8 /100 | #55 | Exceptional 1.6% |
| Immigrants | North America | 99.8 /100 | #56 | Exceptional 1.6% |
| Austrians | 99.8 /100 | #57 | Exceptional 1.6% |
| Kiowa | 99.8 /100 | #58 | Exceptional 1.6% |
| Slavs | 99.8 /100 | #59 | Exceptional 1.7% |
| Americans | 99.8 /100 | #60 | Exceptional 1.7% |
| Tsimshian | 99.8 /100 | #61 | Exceptional 1.7% |
| Immigrants | Northern Europe | 99.8 /100 | #62 | Exceptional 1.7% |
| Russians | 99.8 /100 | #63 | Exceptional 1.7% |
| New Zealanders | 99.7 /100 | #64 | Exceptional 1.7% |
| Serbians | 99.7 /100 | #65 | Exceptional 1.7% |
| Canadians | 99.7 /100 | #66 | Exceptional 1.7% |
Demographics Similar to Immigrants from Australia by No Schooling Completed
In terms of no schooling completed, the demographic groups most similar to Immigrants from Australia are Immigrants from Denmark (1.7%, a difference of 0.040%), Ukrainian (1.8%, a difference of 0.050%), Potawatomi (1.7%, a difference of 0.090%), Immigrants from South Africa (1.7%, a difference of 0.20%), and Icelander (1.7%, a difference of 0.29%).
| Demographics | Rating | Rank | No Schooling Completed |
| Delaware | 99.3 /100 | #78 | Exceptional 1.7% |
| Macedonians | 99.3 /100 | #79 | Exceptional 1.7% |
| Cypriots | 99.3 /100 | #80 | Exceptional 1.7% |
| Icelanders | 99.3 /100 | #81 | Exceptional 1.7% |
| Immigrants | South Africa | 99.3 /100 | #82 | Exceptional 1.7% |
| Potawatomi | 99.3 /100 | #83 | Exceptional 1.7% |
| Immigrants | Denmark | 99.2 /100 | #84 | Exceptional 1.7% |
| Immigrants | Australia | 99.2 /100 | #85 | Exceptional 1.7% |
| Ukrainians | 99.2 /100 | #86 | Exceptional 1.8% |
| Osage | 99.2 /100 | #87 | Exceptional 1.8% |
| Immigrants | Western Europe | 99.2 /100 | #88 | Exceptional 1.8% |
| South Africans | 99.1 /100 | #89 | Exceptional 1.8% |
| Sioux | 99.0 /100 | #90 | Exceptional 1.8% |
| Immigrants | Germany | 99.0 /100 | #91 | Exceptional 1.8% |
| Romanians | 98.8 /100 | #92 | Exceptional 1.8% |