Sioux vs West Indian Professional Degree
COMPARE
Sioux
West Indian
Professional Degree
Professional Degree Comparison
Sioux
West Indians
3.3%
PROFESSIONAL DEGREE
0.1/ 100
METRIC RATING
312th/ 347
METRIC RANK
4.1%
PROFESSIONAL DEGREE
9.8/ 100
METRIC RATING
216th/ 347
METRIC RANK
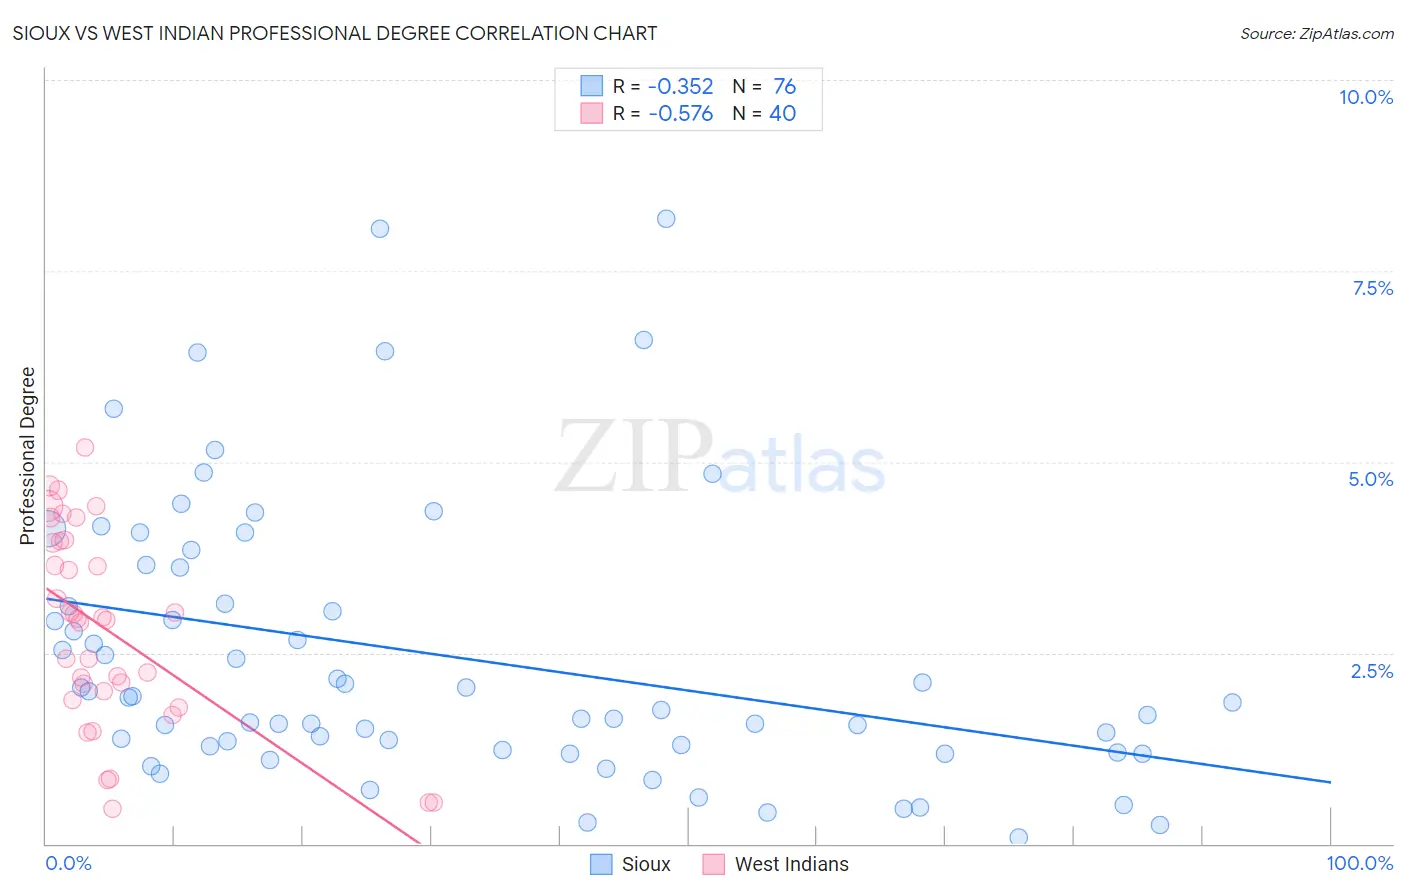
Sioux vs West Indian Professional Degree Correlation Chart
The statistical analysis conducted on geographies consisting of 233,329,443 people shows a mild negative correlation between the proportion of Sioux and percentage of population with at least professional degree education in the United States with a correlation coefficient (R) of -0.352 and weighted average of 3.3%. Similarly, the statistical analysis conducted on geographies consisting of 253,709,742 people shows a substantial negative correlation between the proportion of West Indians and percentage of population with at least professional degree education in the United States with a correlation coefficient (R) of -0.576 and weighted average of 4.1%, a difference of 23.7%.
Professional Degree Correlation Summary
| Measurement | Sioux | West Indian |
| Minimum | 0.086% | 0.46% |
| Maximum | 8.2% | 5.2% |
| Range | 8.1% | 4.7% |
| Mean | 2.5% | 2.8% |
| Median | 1.9% | 2.9% |
| Interquartile 25% (IQ1) | 1.2% | 1.9% |
| Interquartile 75% (IQ3) | 3.4% | 3.9% |
| Interquartile Range (IQR) | 2.1% | 2.0% |
| Standard Deviation (Sample) | 1.8% | 1.3% |
| Standard Deviation (Population) | 1.8% | 1.3% |
Similar Demographics by Professional Degree
Demographics Similar to Sioux by Professional Degree
In terms of professional degree, the demographic groups most similar to Sioux are Yuman (3.3%, a difference of 0.010%), Mexican American Indian (3.3%, a difference of 0.23%), Cherokee (3.3%, a difference of 0.59%), Immigrants from Latin America (3.3%, a difference of 0.75%), and Immigrants from Laos (3.2%, a difference of 0.91%).
| Demographics | Rating | Rank | Professional Degree |
| Chickasaw | 0.1 /100 | #305 | Tragic 3.4% |
| Cape Verdeans | 0.1 /100 | #306 | Tragic 3.4% |
| Samoans | 0.1 /100 | #307 | Tragic 3.3% |
| Shoshone | 0.1 /100 | #308 | Tragic 3.3% |
| Pima | 0.1 /100 | #309 | Tragic 3.3% |
| Immigrants | Latin America | 0.1 /100 | #310 | Tragic 3.3% |
| Cherokee | 0.1 /100 | #311 | Tragic 3.3% |
| Sioux | 0.1 /100 | #312 | Tragic 3.3% |
| Yuman | 0.1 /100 | #313 | Tragic 3.3% |
| Mexican American Indians | 0.1 /100 | #314 | Tragic 3.3% |
| Immigrants | Laos | 0.1 /100 | #315 | Tragic 3.2% |
| Puerto Ricans | 0.1 /100 | #316 | Tragic 3.2% |
| Nepalese | 0.1 /100 | #317 | Tragic 3.2% |
| Immigrants | Micronesia | 0.1 /100 | #318 | Tragic 3.2% |
| Choctaw | 0.1 /100 | #319 | Tragic 3.2% |
Demographics Similar to West Indians by Professional Degree
In terms of professional degree, the demographic groups most similar to West Indians are Immigrants from Vietnam (4.0%, a difference of 0.16%), Portuguese (4.1%, a difference of 0.31%), Immigrants from Ghana (4.1%, a difference of 0.37%), Dutch (4.0%, a difference of 0.37%), and Immigrants from South Eastern Asia (4.0%, a difference of 0.40%).
| Demographics | Rating | Rank | Professional Degree |
| Immigrants | Panama | 12.3 /100 | #209 | Poor 4.1% |
| Immigrants | Nigeria | 11.7 /100 | #210 | Poor 4.1% |
| Germans | 11.6 /100 | #211 | Poor 4.1% |
| Whites/Caucasians | 11.2 /100 | #212 | Poor 4.1% |
| Koreans | 10.7 /100 | #213 | Poor 4.1% |
| Immigrants | Ghana | 10.6 /100 | #214 | Poor 4.1% |
| Portuguese | 10.5 /100 | #215 | Poor 4.1% |
| West Indians | 9.8 /100 | #216 | Tragic 4.1% |
| Immigrants | Vietnam | 9.4 /100 | #217 | Tragic 4.0% |
| Dutch | 9.0 /100 | #218 | Tragic 4.0% |
| Immigrants | South Eastern Asia | 8.9 /100 | #219 | Tragic 4.0% |
| Ute | 8.2 /100 | #220 | Tragic 4.0% |
| French Canadians | 8.0 /100 | #221 | Tragic 4.0% |
| Immigrants | Western Africa | 7.5 /100 | #222 | Tragic 4.0% |
| Immigrants | Bosnia and Herzegovina | 7.4 /100 | #223 | Tragic 4.0% |