Sioux vs Barbadian Professional Degree
COMPARE
Sioux
Barbadian
Professional Degree
Professional Degree Comparison
Sioux
Barbadians
3.3%
PROFESSIONAL DEGREE
0.1/ 100
METRIC RATING
312th/ 347
METRIC RANK
4.1%
PROFESSIONAL DEGREE
15.8/ 100
METRIC RATING
204th/ 347
METRIC RANK
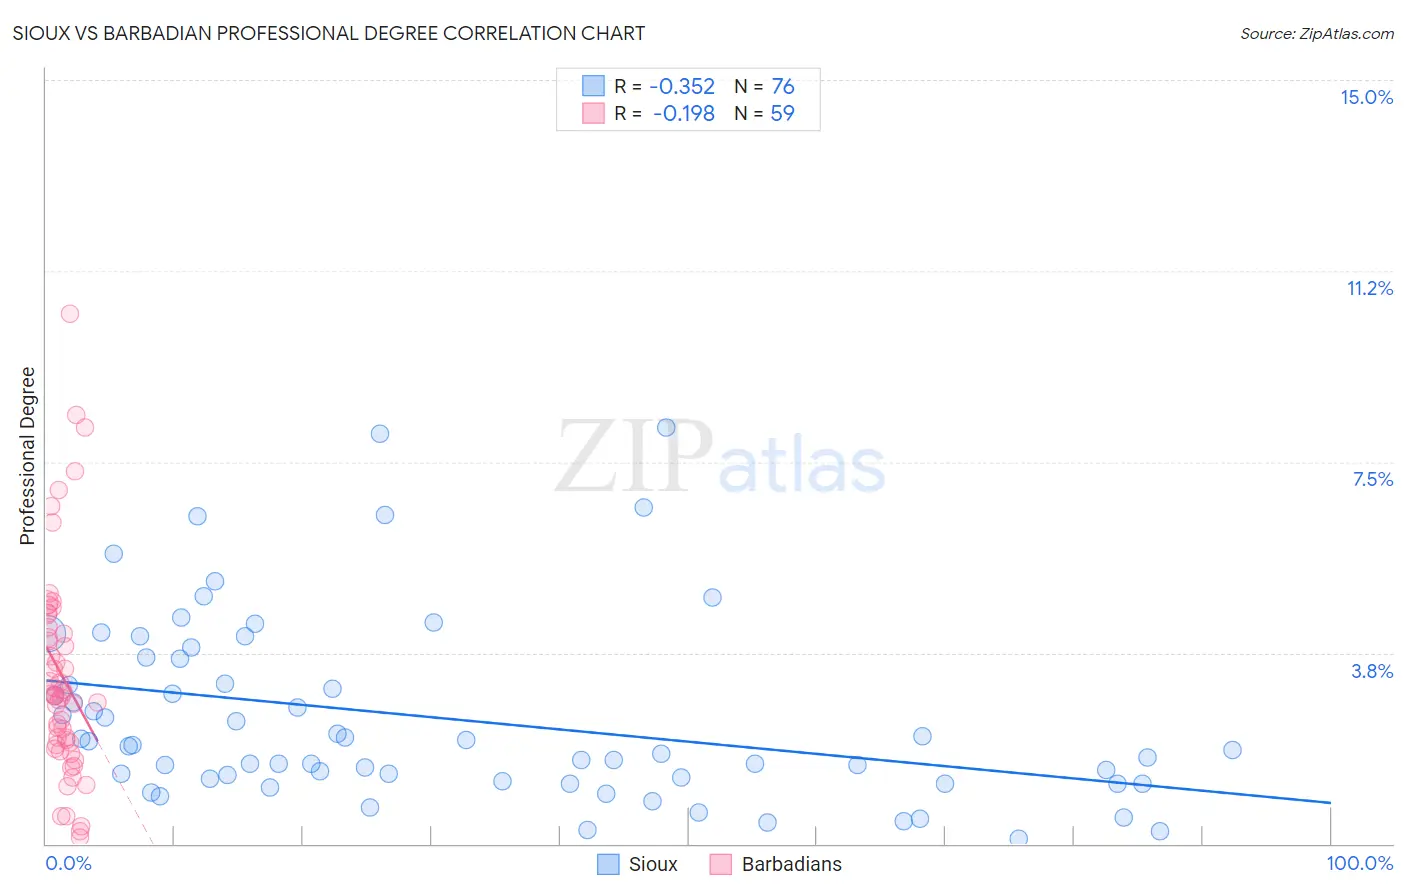
Sioux vs Barbadian Professional Degree Correlation Chart
The statistical analysis conducted on geographies consisting of 233,329,443 people shows a mild negative correlation between the proportion of Sioux and percentage of population with at least professional degree education in the United States with a correlation coefficient (R) of -0.352 and weighted average of 3.3%. Similarly, the statistical analysis conducted on geographies consisting of 141,223,828 people shows a poor negative correlation between the proportion of Barbadians and percentage of population with at least professional degree education in the United States with a correlation coefficient (R) of -0.198 and weighted average of 4.1%, a difference of 26.4%.
Professional Degree Correlation Summary
| Measurement | Sioux | Barbadian |
| Minimum | 0.086% | 0.13% |
| Maximum | 8.2% | 10.4% |
| Range | 8.1% | 10.3% |
| Mean | 2.5% | 3.3% |
| Median | 1.9% | 2.9% |
| Interquartile 25% (IQ1) | 1.2% | 1.9% |
| Interquartile 75% (IQ3) | 3.4% | 4.2% |
| Interquartile Range (IQR) | 2.1% | 2.3% |
| Standard Deviation (Sample) | 1.8% | 2.1% |
| Standard Deviation (Population) | 1.8% | 2.1% |
Similar Demographics by Professional Degree
Demographics Similar to Sioux by Professional Degree
In terms of professional degree, the demographic groups most similar to Sioux are Yuman (3.3%, a difference of 0.010%), Mexican American Indian (3.3%, a difference of 0.23%), Cherokee (3.3%, a difference of 0.59%), Immigrants from Latin America (3.3%, a difference of 0.75%), and Immigrants from Laos (3.2%, a difference of 0.91%).
| Demographics | Rating | Rank | Professional Degree |
| Chickasaw | 0.1 /100 | #305 | Tragic 3.4% |
| Cape Verdeans | 0.1 /100 | #306 | Tragic 3.4% |
| Samoans | 0.1 /100 | #307 | Tragic 3.3% |
| Shoshone | 0.1 /100 | #308 | Tragic 3.3% |
| Pima | 0.1 /100 | #309 | Tragic 3.3% |
| Immigrants | Latin America | 0.1 /100 | #310 | Tragic 3.3% |
| Cherokee | 0.1 /100 | #311 | Tragic 3.3% |
| Sioux | 0.1 /100 | #312 | Tragic 3.3% |
| Yuman | 0.1 /100 | #313 | Tragic 3.3% |
| Mexican American Indians | 0.1 /100 | #314 | Tragic 3.3% |
| Immigrants | Laos | 0.1 /100 | #315 | Tragic 3.2% |
| Puerto Ricans | 0.1 /100 | #316 | Tragic 3.2% |
| Nepalese | 0.1 /100 | #317 | Tragic 3.2% |
| Immigrants | Micronesia | 0.1 /100 | #318 | Tragic 3.2% |
| Choctaw | 0.1 /100 | #319 | Tragic 3.2% |
Demographics Similar to Barbadians by Professional Degree
In terms of professional degree, the demographic groups most similar to Barbadians are Panamanian (4.1%, a difference of 0.030%), Somali (4.1%, a difference of 0.32%), Immigrants from Iraq (4.2%, a difference of 0.36%), Yugoslavian (4.1%, a difference of 0.75%), and Finnish (4.2%, a difference of 0.79%).
| Demographics | Rating | Rank | Professional Degree |
| Czechoslovakians | 22.4 /100 | #197 | Fair 4.2% |
| Immigrants | Middle Africa | 22.1 /100 | #198 | Fair 4.2% |
| Norwegians | 20.5 /100 | #199 | Fair 4.2% |
| Immigrants | North Macedonia | 20.2 /100 | #200 | Fair 4.2% |
| Finns | 18.7 /100 | #201 | Poor 4.2% |
| Immigrants | Iraq | 17.1 /100 | #202 | Poor 4.2% |
| Panamanians | 15.9 /100 | #203 | Poor 4.1% |
| Barbadians | 15.8 /100 | #204 | Poor 4.1% |
| Somalis | 14.8 /100 | #205 | Poor 4.1% |
| Yugoslavians | 13.4 /100 | #206 | Poor 4.1% |
| Sub-Saharan Africans | 12.8 /100 | #207 | Poor 4.1% |
| Immigrants | Somalia | 12.5 /100 | #208 | Poor 4.1% |
| Immigrants | Panama | 12.3 /100 | #209 | Poor 4.1% |
| Immigrants | Nigeria | 11.7 /100 | #210 | Poor 4.1% |
| Germans | 11.6 /100 | #211 | Poor 4.1% |