Sioux vs Bermudan Professional Degree
COMPARE
Sioux
Bermudan
Professional Degree
Professional Degree Comparison
Sioux
Bermudans
3.3%
PROFESSIONAL DEGREE
0.1/ 100
METRIC RATING
312th/ 347
METRIC RANK
4.4%
PROFESSIONAL DEGREE
43.1/ 100
METRIC RATING
183rd/ 347
METRIC RANK
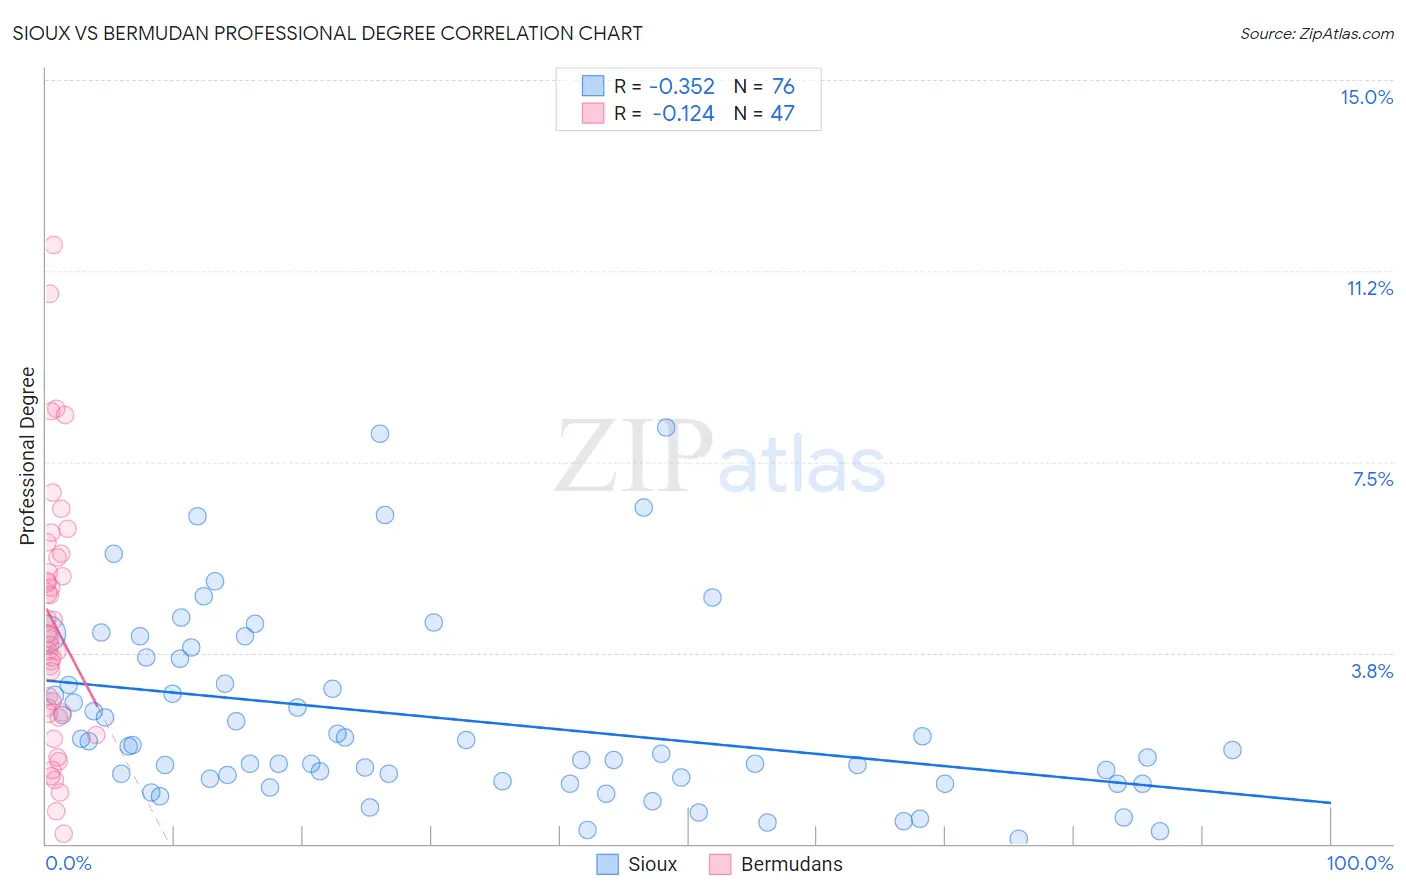
Sioux vs Bermudan Professional Degree Correlation Chart
The statistical analysis conducted on geographies consisting of 233,329,443 people shows a mild negative correlation between the proportion of Sioux and percentage of population with at least professional degree education in the United States with a correlation coefficient (R) of -0.352 and weighted average of 3.3%. Similarly, the statistical analysis conducted on geographies consisting of 55,708,616 people shows a poor negative correlation between the proportion of Bermudans and percentage of population with at least professional degree education in the United States with a correlation coefficient (R) of -0.124 and weighted average of 4.4%, a difference of 33.2%.
Professional Degree Correlation Summary
| Measurement | Sioux | Bermudan |
| Minimum | 0.086% | 0.19% |
| Maximum | 8.2% | 11.8% |
| Range | 8.1% | 11.6% |
| Mean | 2.5% | 4.3% |
| Median | 1.9% | 4.0% |
| Interquartile 25% (IQ1) | 1.2% | 2.5% |
| Interquartile 75% (IQ3) | 3.4% | 5.6% |
| Interquartile Range (IQR) | 2.1% | 3.1% |
| Standard Deviation (Sample) | 1.8% | 2.5% |
| Standard Deviation (Population) | 1.8% | 2.5% |
Similar Demographics by Professional Degree
Demographics Similar to Sioux by Professional Degree
In terms of professional degree, the demographic groups most similar to Sioux are Yuman (3.3%, a difference of 0.010%), Mexican American Indian (3.3%, a difference of 0.23%), Cherokee (3.3%, a difference of 0.59%), Immigrants from Latin America (3.3%, a difference of 0.75%), and Immigrants from Laos (3.2%, a difference of 0.91%).
| Demographics | Rating | Rank | Professional Degree |
| Chickasaw | 0.1 /100 | #305 | Tragic 3.4% |
| Cape Verdeans | 0.1 /100 | #306 | Tragic 3.4% |
| Samoans | 0.1 /100 | #307 | Tragic 3.3% |
| Shoshone | 0.1 /100 | #308 | Tragic 3.3% |
| Pima | 0.1 /100 | #309 | Tragic 3.3% |
| Immigrants | Latin America | 0.1 /100 | #310 | Tragic 3.3% |
| Cherokee | 0.1 /100 | #311 | Tragic 3.3% |
| Sioux | 0.1 /100 | #312 | Tragic 3.3% |
| Yuman | 0.1 /100 | #313 | Tragic 3.3% |
| Mexican American Indians | 0.1 /100 | #314 | Tragic 3.3% |
| Immigrants | Laos | 0.1 /100 | #315 | Tragic 3.2% |
| Puerto Ricans | 0.1 /100 | #316 | Tragic 3.2% |
| Nepalese | 0.1 /100 | #317 | Tragic 3.2% |
| Immigrants | Micronesia | 0.1 /100 | #318 | Tragic 3.2% |
| Choctaw | 0.1 /100 | #319 | Tragic 3.2% |
Demographics Similar to Bermudans by Professional Degree
In terms of professional degree, the demographic groups most similar to Bermudans are Immigrants (4.4%, a difference of 0.010%), Danish (4.4%, a difference of 0.060%), Czech (4.4%, a difference of 0.28%), Immigrants from Kenya (4.4%, a difference of 0.42%), and Immigrants from Costa Rica (4.4%, a difference of 0.53%).
| Demographics | Rating | Rank | Professional Degree |
| Immigrants | Peru | 49.3 /100 | #176 | Average 4.4% |
| Celtics | 47.6 /100 | #177 | Average 4.4% |
| Immigrants | Costa Rica | 46.7 /100 | #178 | Average 4.4% |
| Immigrants | Kenya | 45.9 /100 | #179 | Average 4.4% |
| Czechs | 44.9 /100 | #180 | Average 4.4% |
| Danes | 43.5 /100 | #181 | Average 4.4% |
| Immigrants | Immigrants | 43.2 /100 | #182 | Average 4.4% |
| Bermudans | 43.1 /100 | #183 | Average 4.4% |
| Belgians | 36.2 /100 | #184 | Fair 4.3% |
| Welsh | 35.8 /100 | #185 | Fair 4.3% |
| Scotch-Irish | 34.2 /100 | #186 | Fair 4.3% |
| Immigrants | Cameroon | 33.3 /100 | #187 | Fair 4.3% |
| Immigrants | Thailand | 31.7 /100 | #188 | Fair 4.3% |
| Slovaks | 30.7 /100 | #189 | Fair 4.3% |
| Immigrants | Poland | 29.2 /100 | #190 | Fair 4.3% |