Sioux vs Choctaw Unemployment Among Ages 60 to 64 years
COMPARE
Sioux
Choctaw
Unemployment Among Ages 60 to 64 years
Unemployment Among Ages 60 to 64 years Comparison
Sioux
Choctaw
5.1%
UNEMPLOYMENT AMONG AGES 60 TO 64 YEARS
0.3/ 100
METRIC RATING
264th/ 347
METRIC RANK
4.8%
UNEMPLOYMENT AMONG AGES 60 TO 64 YEARS
90.3/ 100
METRIC RATING
128th/ 347
METRIC RANK
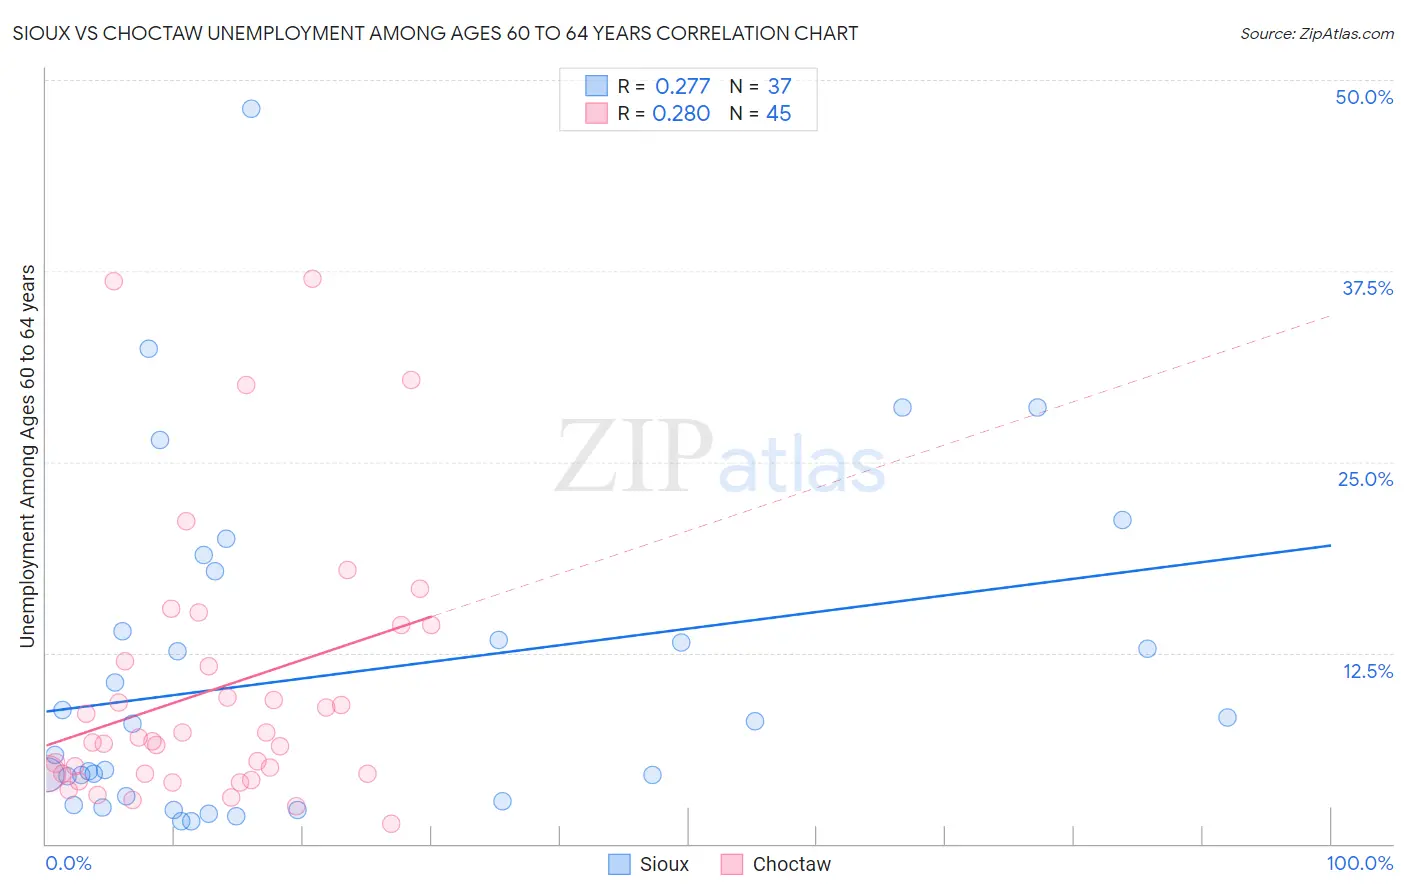
Sioux vs Choctaw Unemployment Among Ages 60 to 64 years Correlation Chart
The statistical analysis conducted on geographies consisting of 214,355,270 people shows a weak positive correlation between the proportion of Sioux and unemployment rate among population between the ages 60 and 64 in the United States with a correlation coefficient (R) of 0.277 and weighted average of 5.1%. Similarly, the statistical analysis conducted on geographies consisting of 244,585,593 people shows a weak positive correlation between the proportion of Choctaw and unemployment rate among population between the ages 60 and 64 in the United States with a correlation coefficient (R) of 0.280 and weighted average of 4.8%, a difference of 7.1%.
Unemployment Among Ages 60 to 64 years Correlation Summary
| Measurement | Sioux | Choctaw |
| Minimum | 1.5% | 1.3% |
| Maximum | 48.1% | 37.0% |
| Range | 46.6% | 35.7% |
| Mean | 11.1% | 10.1% |
| Median | 7.8% | 6.7% |
| Interquartile 25% (IQ1) | 3.0% | 4.6% |
| Interquartile 75% (IQ3) | 15.9% | 13.1% |
| Interquartile Range (IQR) | 12.9% | 8.5% |
| Standard Deviation (Sample) | 10.7% | 8.7% |
| Standard Deviation (Population) | 10.6% | 8.6% |
Similar Demographics by Unemployment Among Ages 60 to 64 years
Demographics Similar to Sioux by Unemployment Among Ages 60 to 64 years
In terms of unemployment among ages 60 to 64 years, the demographic groups most similar to Sioux are Immigrants (5.1%, a difference of 0.080%), Immigrants from Uzbekistan (5.1%, a difference of 0.10%), Immigrants from Ghana (5.1%, a difference of 0.12%), Immigrants from Honduras (5.1%, a difference of 0.22%), and Immigrants from Argentina (5.1%, a difference of 0.34%).
| Demographics | Rating | Rank | Unemployment Among Ages 60 to 64 years |
| Japanese | 0.6 /100 | #257 | Tragic 5.1% |
| Celtics | 0.5 /100 | #258 | Tragic 5.1% |
| Hondurans | 0.5 /100 | #259 | Tragic 5.1% |
| Immigrants | Honduras | 0.4 /100 | #260 | Tragic 5.1% |
| Immigrants | Ghana | 0.4 /100 | #261 | Tragic 5.1% |
| Immigrants | Uzbekistan | 0.4 /100 | #262 | Tragic 5.1% |
| Immigrants | Immigrants | 0.4 /100 | #263 | Tragic 5.1% |
| Sioux | 0.3 /100 | #264 | Tragic 5.1% |
| Immigrants | Argentina | 0.2 /100 | #265 | Tragic 5.1% |
| Immigrants | Australia | 0.2 /100 | #266 | Tragic 5.1% |
| Immigrants | Bahamas | 0.2 /100 | #267 | Tragic 5.1% |
| Central American Indians | 0.2 /100 | #268 | Tragic 5.1% |
| Immigrants | Costa Rica | 0.2 /100 | #269 | Tragic 5.1% |
| Immigrants | Iran | 0.1 /100 | #270 | Tragic 5.1% |
| Israelis | 0.1 /100 | #271 | Tragic 5.2% |
Demographics Similar to Choctaw by Unemployment Among Ages 60 to 64 years
In terms of unemployment among ages 60 to 64 years, the demographic groups most similar to Choctaw are Immigrants from Serbia (4.8%, a difference of 0.010%), Immigrants from Syria (4.8%, a difference of 0.020%), Immigrants from Lebanon (4.8%, a difference of 0.070%), Lithuanian (4.8%, a difference of 0.070%), and Yaqui (4.8%, a difference of 0.090%).
| Demographics | Rating | Rank | Unemployment Among Ages 60 to 64 years |
| Albanians | 95.3 /100 | #121 | Exceptional 4.7% |
| Immigrants | Kazakhstan | 95.1 /100 | #122 | Exceptional 4.7% |
| Finns | 94.7 /100 | #123 | Exceptional 4.7% |
| Immigrants | Senegal | 94.5 /100 | #124 | Exceptional 4.7% |
| Immigrants | Thailand | 93.7 /100 | #125 | Exceptional 4.7% |
| Immigrants | South Central Asia | 93.0 /100 | #126 | Exceptional 4.7% |
| Austrians | 91.9 /100 | #127 | Exceptional 4.8% |
| Choctaw | 90.3 /100 | #128 | Exceptional 4.8% |
| Immigrants | Serbia | 90.2 /100 | #129 | Exceptional 4.8% |
| Immigrants | Syria | 90.1 /100 | #130 | Exceptional 4.8% |
| Immigrants | Lebanon | 89.6 /100 | #131 | Excellent 4.8% |
| Lithuanians | 89.6 /100 | #132 | Excellent 4.8% |
| Yaqui | 89.5 /100 | #133 | Excellent 4.8% |
| Basques | 88.8 /100 | #134 | Excellent 4.8% |
| Pennsylvania Germans | 87.8 /100 | #135 | Excellent 4.8% |