Sierra Leonean vs Immigrants from Asia GED/Equivalency
COMPARE
Sierra Leonean
Immigrants from Asia
GED/Equivalency
GED/Equivalency Comparison
Sierra Leoneans
Immigrants from Asia
86.0%
GED/EQUIVALENCY
61.8/ 100
METRIC RATING
168th/ 347
METRIC RANK
86.6%
GED/EQUIVALENCY
87.4/ 100
METRIC RATING
135th/ 347
METRIC RANK
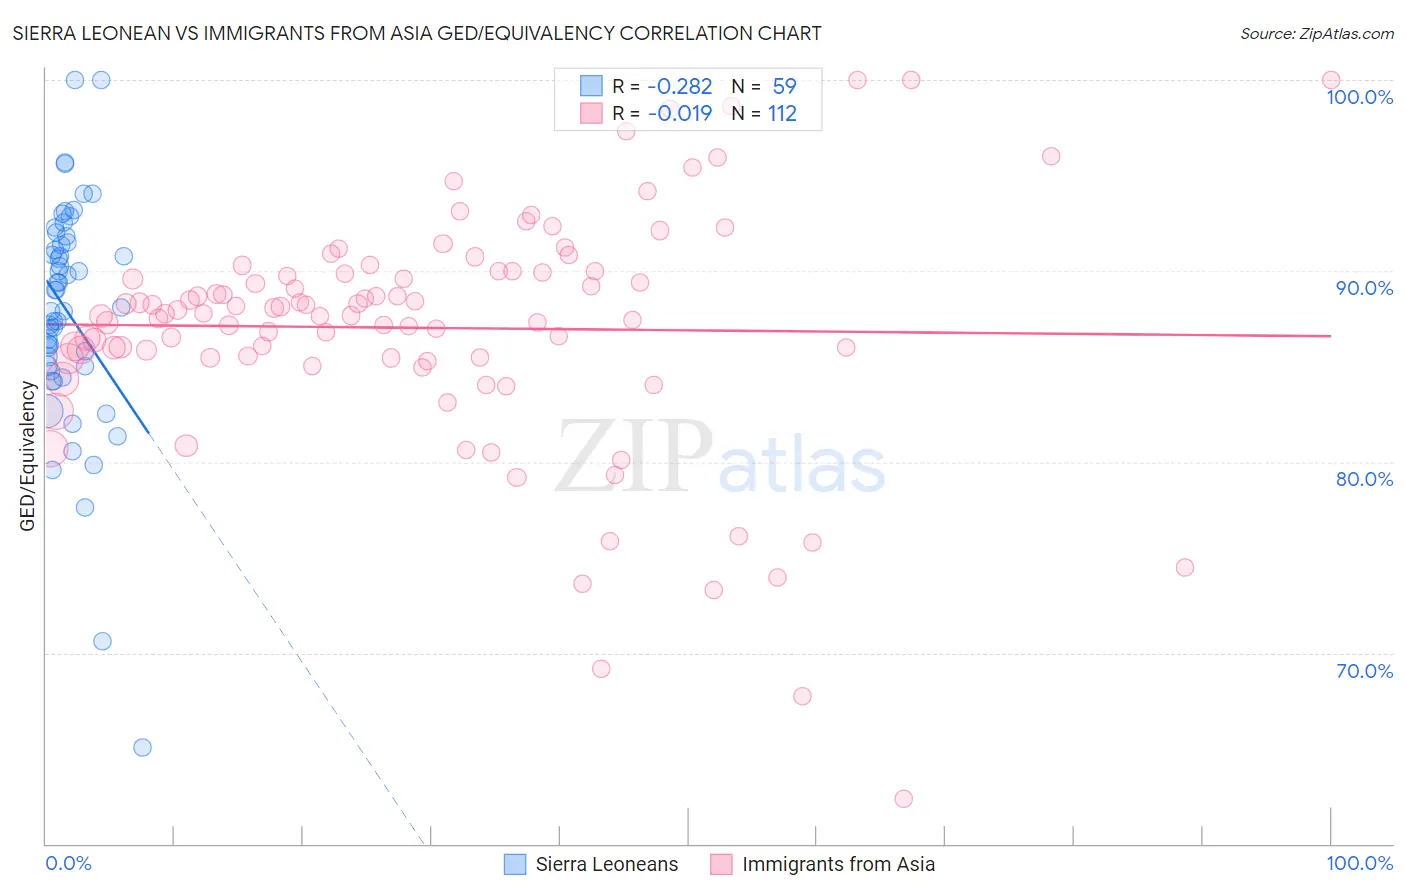
Sierra Leonean vs Immigrants from Asia GED/Equivalency Correlation Chart
The statistical analysis conducted on geographies consisting of 83,357,120 people shows a weak negative correlation between the proportion of Sierra Leoneans and percentage of population with at least ged/equivalency education in the United States with a correlation coefficient (R) of -0.282 and weighted average of 86.0%. Similarly, the statistical analysis conducted on geographies consisting of 549,170,250 people shows no correlation between the proportion of Immigrants from Asia and percentage of population with at least ged/equivalency education in the United States with a correlation coefficient (R) of -0.019 and weighted average of 86.6%, a difference of 0.74%.
GED/Equivalency Correlation Summary
| Measurement | Sierra Leonean | Immigrants from Asia |
| Minimum | 65.0% | 62.4% |
| Maximum | 100.0% | 100.0% |
| Range | 35.0% | 37.6% |
| Mean | 87.8% | 87.0% |
| Median | 88.1% | 87.8% |
| Interquartile 25% (IQ1) | 85.0% | 85.4% |
| Interquartile 75% (IQ3) | 91.5% | 90.0% |
| Interquartile Range (IQR) | 6.5% | 4.5% |
| Standard Deviation (Sample) | 6.0% | 6.3% |
| Standard Deviation (Population) | 6.0% | 6.3% |
Similar Demographics by GED/Equivalency
Demographics Similar to Sierra Leoneans by GED/Equivalency
In terms of ged/equivalency, the demographic groups most similar to Sierra Leoneans are Immigrants from Ethiopia (86.0%, a difference of 0.010%), Ethiopian (86.0%, a difference of 0.040%), Alsatian (86.0%, a difference of 0.050%), Immigrants from Albania (86.0%, a difference of 0.050%), and Afghan (85.9%, a difference of 0.050%).
| Demographics | Rating | Rank | GED/Equivalency |
| Immigrants | Syria | 69.3 /100 | #161 | Good 86.1% |
| Immigrants | Iraq | 68.1 /100 | #162 | Good 86.1% |
| Ugandans | 66.3 /100 | #163 | Good 86.1% |
| Venezuelans | 65.5 /100 | #164 | Good 86.0% |
| Alsatians | 64.3 /100 | #165 | Good 86.0% |
| Immigrants | Albania | 64.2 /100 | #166 | Good 86.0% |
| Ethiopians | 63.7 /100 | #167 | Good 86.0% |
| Sierra Leoneans | 61.8 /100 | #168 | Good 86.0% |
| Immigrants | Ethiopia | 61.2 /100 | #169 | Good 86.0% |
| Afghans | 59.7 /100 | #170 | Average 85.9% |
| Immigrants | Chile | 57.3 /100 | #171 | Average 85.9% |
| Bermudans | 55.1 /100 | #172 | Average 85.8% |
| Immigrants | Venezuela | 50.7 /100 | #173 | Average 85.8% |
| Ottawa | 50.0 /100 | #174 | Average 85.8% |
| Immigrants | Bolivia | 49.8 /100 | #175 | Average 85.8% |
Demographics Similar to Immigrants from Asia by GED/Equivalency
In terms of ged/equivalency, the demographic groups most similar to Immigrants from Asia are Albanian (86.6%, a difference of 0.010%), Chilean (86.6%, a difference of 0.020%), Arab (86.6%, a difference of 0.030%), Tsimshian (86.6%, a difference of 0.040%), and Immigrants from Argentina (86.6%, a difference of 0.040%).
| Demographics | Rating | Rank | GED/Equivalency |
| Yugoslavians | 89.5 /100 | #128 | Excellent 86.7% |
| Immigrants | Ukraine | 88.9 /100 | #129 | Excellent 86.7% |
| Immigrants | Germany | 88.8 /100 | #130 | Excellent 86.7% |
| Immigrants | Spain | 88.5 /100 | #131 | Excellent 86.7% |
| Immigrants | Brazil | 88.4 /100 | #132 | Excellent 86.6% |
| Tsimshian | 88.3 /100 | #133 | Excellent 86.6% |
| Albanians | 87.7 /100 | #134 | Excellent 86.6% |
| Immigrants | Asia | 87.4 /100 | #135 | Excellent 86.6% |
| Chileans | 86.9 /100 | #136 | Excellent 86.6% |
| Arabs | 86.7 /100 | #137 | Excellent 86.6% |
| Immigrants | Argentina | 86.5 /100 | #138 | Excellent 86.6% |
| Immigrants | Malaysia | 85.0 /100 | #139 | Excellent 86.5% |
| Paraguayans | 84.1 /100 | #140 | Excellent 86.5% |
| Laotians | 83.2 /100 | #141 | Excellent 86.5% |
| Immigrants | Indonesia | 82.4 /100 | #142 | Excellent 86.4% |