Sierra Leonean vs English GED/Equivalency
COMPARE
Sierra Leonean
English
GED/Equivalency
GED/Equivalency Comparison
Sierra Leoneans
English
86.0%
GED/EQUIVALENCY
61.8/ 100
METRIC RATING
168th/ 347
METRIC RANK
87.6%
GED/EQUIVALENCY
98.6/ 100
METRIC RATING
79th/ 347
METRIC RANK
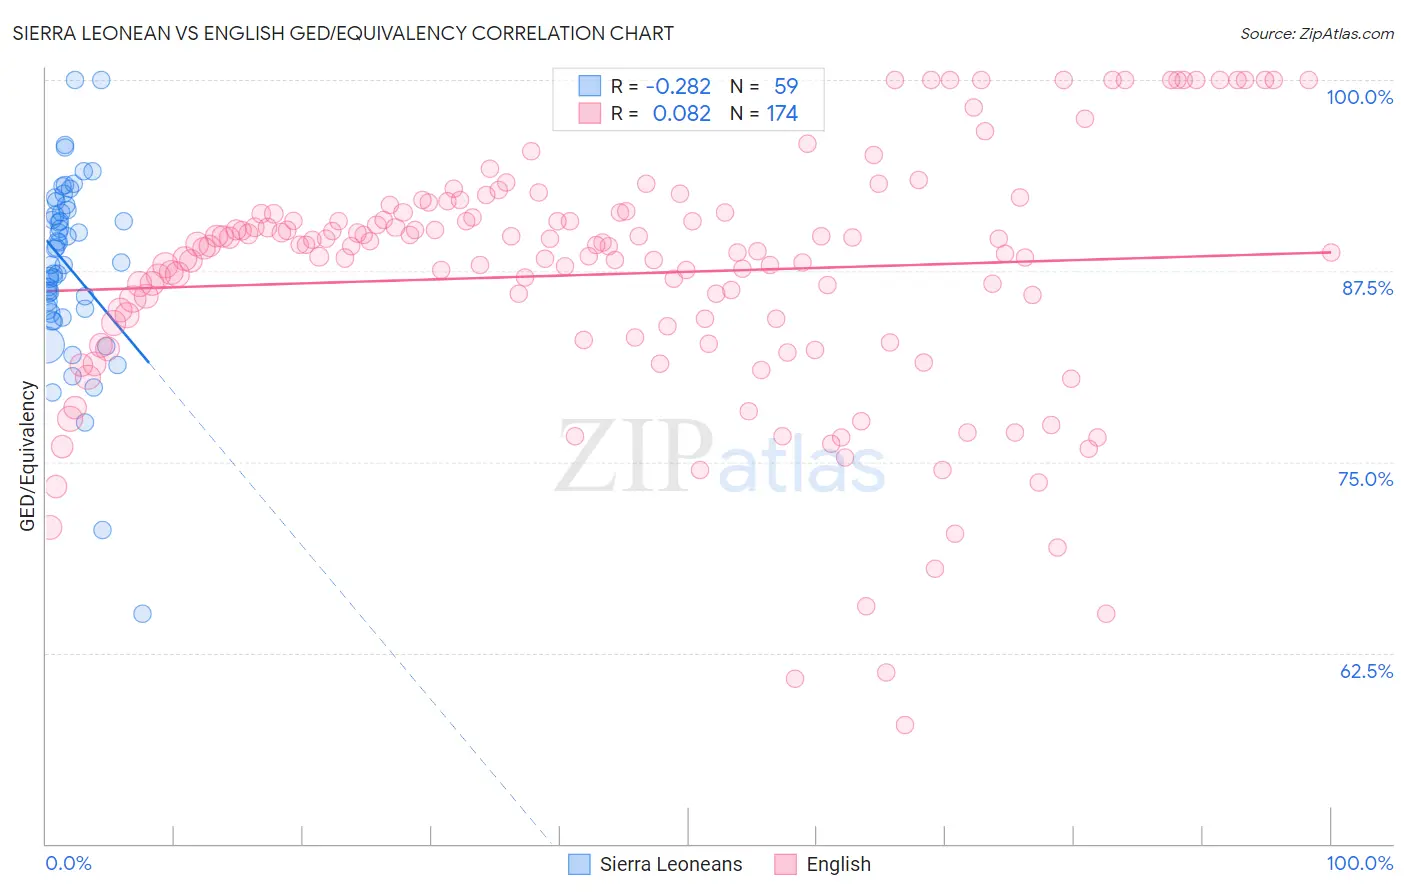
Sierra Leonean vs English GED/Equivalency Correlation Chart
The statistical analysis conducted on geographies consisting of 83,357,120 people shows a weak negative correlation between the proportion of Sierra Leoneans and percentage of population with at least ged/equivalency education in the United States with a correlation coefficient (R) of -0.282 and weighted average of 86.0%. Similarly, the statistical analysis conducted on geographies consisting of 579,979,946 people shows a slight positive correlation between the proportion of English and percentage of population with at least ged/equivalency education in the United States with a correlation coefficient (R) of 0.082 and weighted average of 87.6%, a difference of 1.9%.
GED/Equivalency Correlation Summary
| Measurement | Sierra Leonean | English |
| Minimum | 65.0% | 57.8% |
| Maximum | 100.0% | 100.0% |
| Range | 35.0% | 42.2% |
| Mean | 87.8% | 87.3% |
| Median | 88.1% | 89.1% |
| Interquartile 25% (IQ1) | 85.0% | 83.9% |
| Interquartile 75% (IQ3) | 91.5% | 91.2% |
| Interquartile Range (IQR) | 6.5% | 7.3% |
| Standard Deviation (Sample) | 6.0% | 8.1% |
| Standard Deviation (Population) | 6.0% | 8.1% |
Similar Demographics by GED/Equivalency
Demographics Similar to Sierra Leoneans by GED/Equivalency
In terms of ged/equivalency, the demographic groups most similar to Sierra Leoneans are Immigrants from Ethiopia (86.0%, a difference of 0.010%), Ethiopian (86.0%, a difference of 0.040%), Alsatian (86.0%, a difference of 0.050%), Immigrants from Albania (86.0%, a difference of 0.050%), and Afghan (85.9%, a difference of 0.050%).
| Demographics | Rating | Rank | GED/Equivalency |
| Immigrants | Syria | 69.3 /100 | #161 | Good 86.1% |
| Immigrants | Iraq | 68.1 /100 | #162 | Good 86.1% |
| Ugandans | 66.3 /100 | #163 | Good 86.1% |
| Venezuelans | 65.5 /100 | #164 | Good 86.0% |
| Alsatians | 64.3 /100 | #165 | Good 86.0% |
| Immigrants | Albania | 64.2 /100 | #166 | Good 86.0% |
| Ethiopians | 63.7 /100 | #167 | Good 86.0% |
| Sierra Leoneans | 61.8 /100 | #168 | Good 86.0% |
| Immigrants | Ethiopia | 61.2 /100 | #169 | Good 86.0% |
| Afghans | 59.7 /100 | #170 | Average 85.9% |
| Immigrants | Chile | 57.3 /100 | #171 | Average 85.9% |
| Bermudans | 55.1 /100 | #172 | Average 85.8% |
| Immigrants | Venezuela | 50.7 /100 | #173 | Average 85.8% |
| Ottawa | 50.0 /100 | #174 | Average 85.8% |
| Immigrants | Bolivia | 49.8 /100 | #175 | Average 85.8% |
Demographics Similar to English by GED/Equivalency
In terms of ged/equivalency, the demographic groups most similar to English are Irish (87.6%, a difference of 0.030%), Immigrants from England (87.6%, a difference of 0.030%), Immigrants from Serbia (87.7%, a difference of 0.050%), Slavic (87.7%, a difference of 0.050%), and Scottish (87.7%, a difference of 0.070%).
| Demographics | Rating | Rank | GED/Equivalency |
| Immigrants | Moldova | 98.8 /100 | #72 | Exceptional 87.7% |
| Belgians | 98.8 /100 | #73 | Exceptional 87.7% |
| Immigrants | Kuwait | 98.8 /100 | #74 | Exceptional 87.7% |
| Scottish | 98.7 /100 | #75 | Exceptional 87.7% |
| Immigrants | Serbia | 98.7 /100 | #76 | Exceptional 87.7% |
| Slavs | 98.7 /100 | #77 | Exceptional 87.7% |
| Irish | 98.6 /100 | #78 | Exceptional 87.6% |
| English | 98.6 /100 | #79 | Exceptional 87.6% |
| Immigrants | England | 98.5 /100 | #80 | Exceptional 87.6% |
| Immigrants | Sri Lanka | 98.3 /100 | #81 | Exceptional 87.5% |
| Romanians | 98.3 /100 | #82 | Exceptional 87.5% |
| South Africans | 98.3 /100 | #83 | Exceptional 87.5% |
| Immigrants | Romania | 98.1 /100 | #84 | Exceptional 87.5% |
| Dutch | 98.1 /100 | #85 | Exceptional 87.5% |
| Immigrants | Europe | 98.1 /100 | #86 | Exceptional 87.5% |