Sierra Leonean vs Immigrants from Belize 7th Grade
COMPARE
Sierra Leonean
Immigrants from Belize
7th Grade
7th Grade Comparison
Sierra Leoneans
Immigrants from Belize
96.0%
7TH GRADE
37.5/ 100
METRIC RATING
184th/ 347
METRIC RANK
93.4%
7TH GRADE
0.0/ 100
METRIC RATING
323rd/ 347
METRIC RANK
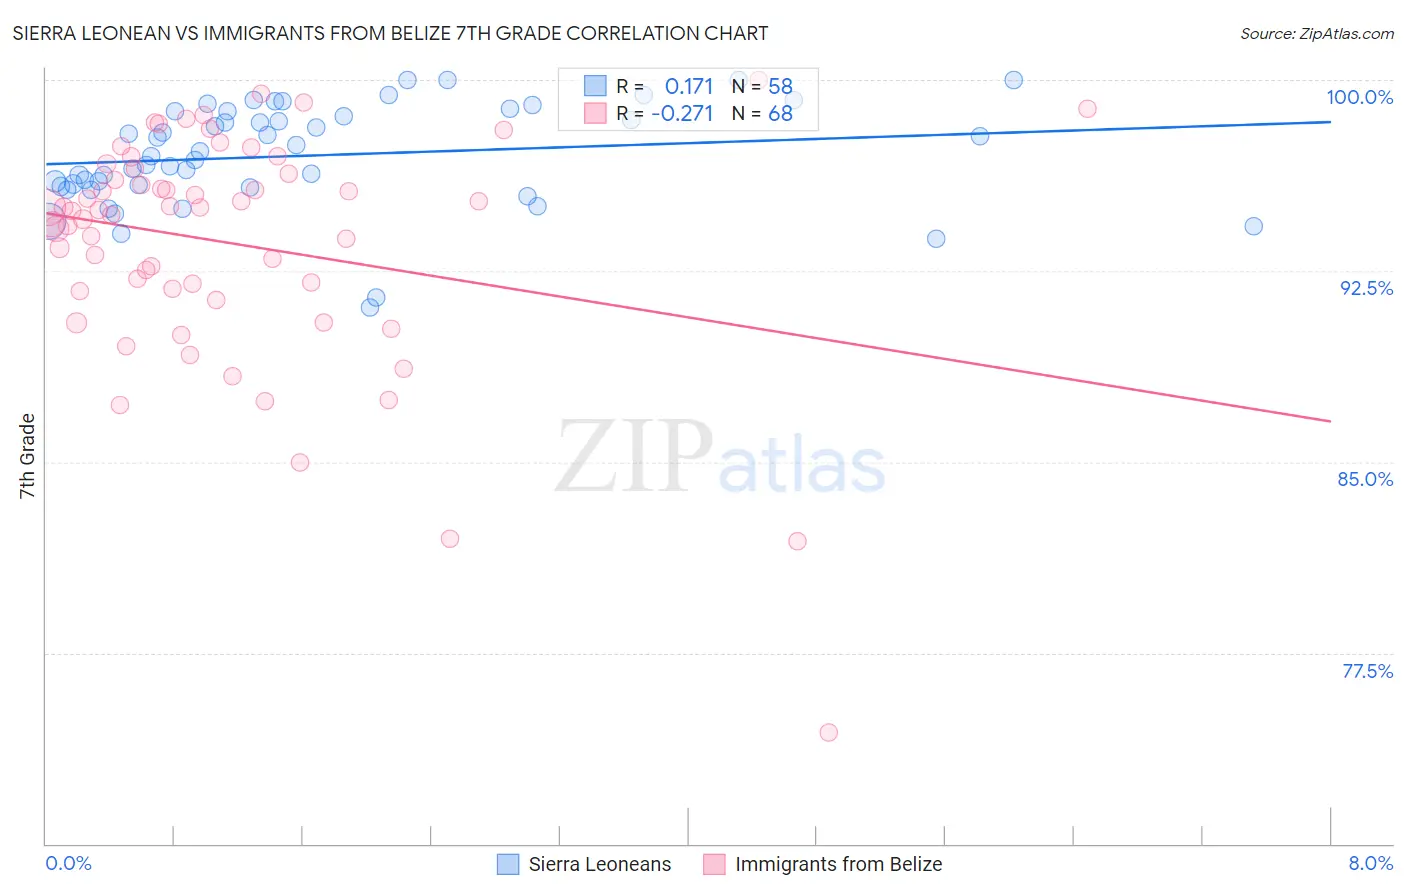
Sierra Leonean vs Immigrants from Belize 7th Grade Correlation Chart
The statistical analysis conducted on geographies consisting of 83,337,655 people shows a poor positive correlation between the proportion of Sierra Leoneans and percentage of population with at least 7th grade education in the United States with a correlation coefficient (R) of 0.171 and weighted average of 96.0%. Similarly, the statistical analysis conducted on geographies consisting of 130,181,087 people shows a weak negative correlation between the proportion of Immigrants from Belize and percentage of population with at least 7th grade education in the United States with a correlation coefficient (R) of -0.271 and weighted average of 93.4%, a difference of 2.8%.
7th Grade Correlation Summary
| Measurement | Sierra Leonean | Immigrants from Belize |
| Minimum | 91.1% | 74.3% |
| Maximum | 100.0% | 100.0% |
| Range | 8.9% | 25.7% |
| Mean | 97.0% | 93.6% |
| Median | 97.1% | 94.9% |
| Interquartile 25% (IQ1) | 95.8% | 91.8% |
| Interquartile 75% (IQ3) | 98.8% | 96.4% |
| Interquartile Range (IQR) | 2.9% | 4.7% |
| Standard Deviation (Sample) | 2.0% | 4.6% |
| Standard Deviation (Population) | 2.0% | 4.5% |
Similar Demographics by 7th Grade
Demographics Similar to Sierra Leoneans by 7th Grade
In terms of 7th grade, the demographic groups most similar to Sierra Leoneans are Brazilian (96.0%, a difference of 0.0%), Immigrants from Spain (96.0%, a difference of 0.010%), Immigrants from Iraq (96.0%, a difference of 0.010%), Immigrants from Uganda (96.0%, a difference of 0.010%), and Iraqi (96.0%, a difference of 0.020%).
| Demographics | Rating | Rank | 7th Grade |
| Immigrants | Korea | 49.2 /100 | #177 | Average 96.0% |
| Marshallese | 48.4 /100 | #178 | Average 96.0% |
| Immigrants | Iran | 47.8 /100 | #179 | Average 96.0% |
| Immigrants | Brazil | 46.8 /100 | #180 | Average 96.0% |
| Pakistanis | 44.5 /100 | #181 | Average 96.0% |
| Iraqis | 41.2 /100 | #182 | Average 96.0% |
| Immigrants | Spain | 38.8 /100 | #183 | Fair 96.0% |
| Sierra Leoneans | 37.5 /100 | #184 | Fair 96.0% |
| Brazilians | 37.3 /100 | #185 | Fair 96.0% |
| Immigrants | Iraq | 36.1 /100 | #186 | Fair 96.0% |
| Immigrants | Uganda | 36.0 /100 | #187 | Fair 96.0% |
| Immigrants | Egypt | 34.3 /100 | #188 | Fair 95.9% |
| Immigrants | Venezuela | 33.9 /100 | #189 | Fair 95.9% |
| Immigrants | Micronesia | 32.6 /100 | #190 | Fair 95.9% |
| Liberians | 32.5 /100 | #191 | Fair 95.9% |
Demographics Similar to Immigrants from Belize by 7th Grade
In terms of 7th grade, the demographic groups most similar to Immigrants from Belize are Dominican (93.3%, a difference of 0.020%), Central American Indian (93.3%, a difference of 0.080%), Nicaraguan (93.5%, a difference of 0.11%), Belizean (93.5%, a difference of 0.15%), and Immigrants from Fiji (93.5%, a difference of 0.19%).
| Demographics | Rating | Rank | 7th Grade |
| Immigrants | Vietnam | 0.0 /100 | #316 | Tragic 93.9% |
| Immigrants | Cuba | 0.0 /100 | #317 | Tragic 93.8% |
| Immigrants | Ecuador | 0.0 /100 | #318 | Tragic 93.7% |
| Immigrants | Cambodia | 0.0 /100 | #319 | Tragic 93.7% |
| Immigrants | Fiji | 0.0 /100 | #320 | Tragic 93.5% |
| Belizeans | 0.0 /100 | #321 | Tragic 93.5% |
| Nicaraguans | 0.0 /100 | #322 | Tragic 93.5% |
| Immigrants | Belize | 0.0 /100 | #323 | Tragic 93.4% |
| Dominicans | 0.0 /100 | #324 | Tragic 93.3% |
| Central American Indians | 0.0 /100 | #325 | Tragic 93.3% |
| Nepalese | 0.0 /100 | #326 | Tragic 93.2% |
| Immigrants | Cabo Verde | 0.0 /100 | #327 | Tragic 93.1% |
| Immigrants | Nicaragua | 0.0 /100 | #328 | Tragic 93.0% |
| Immigrants | Azores | 0.0 /100 | #329 | Tragic 93.0% |
| Immigrants | Dominican Republic | 0.0 /100 | #330 | Tragic 92.9% |