Sierra Leonean vs Immigrants from Congo 7th Grade
COMPARE
Sierra Leonean
Immigrants from Congo
7th Grade
7th Grade Comparison
Sierra Leoneans
Immigrants from Congo
96.0%
7TH GRADE
37.5/ 100
METRIC RATING
184th/ 347
METRIC RANK
95.3%
7TH GRADE
0.7/ 100
METRIC RATING
257th/ 347
METRIC RANK
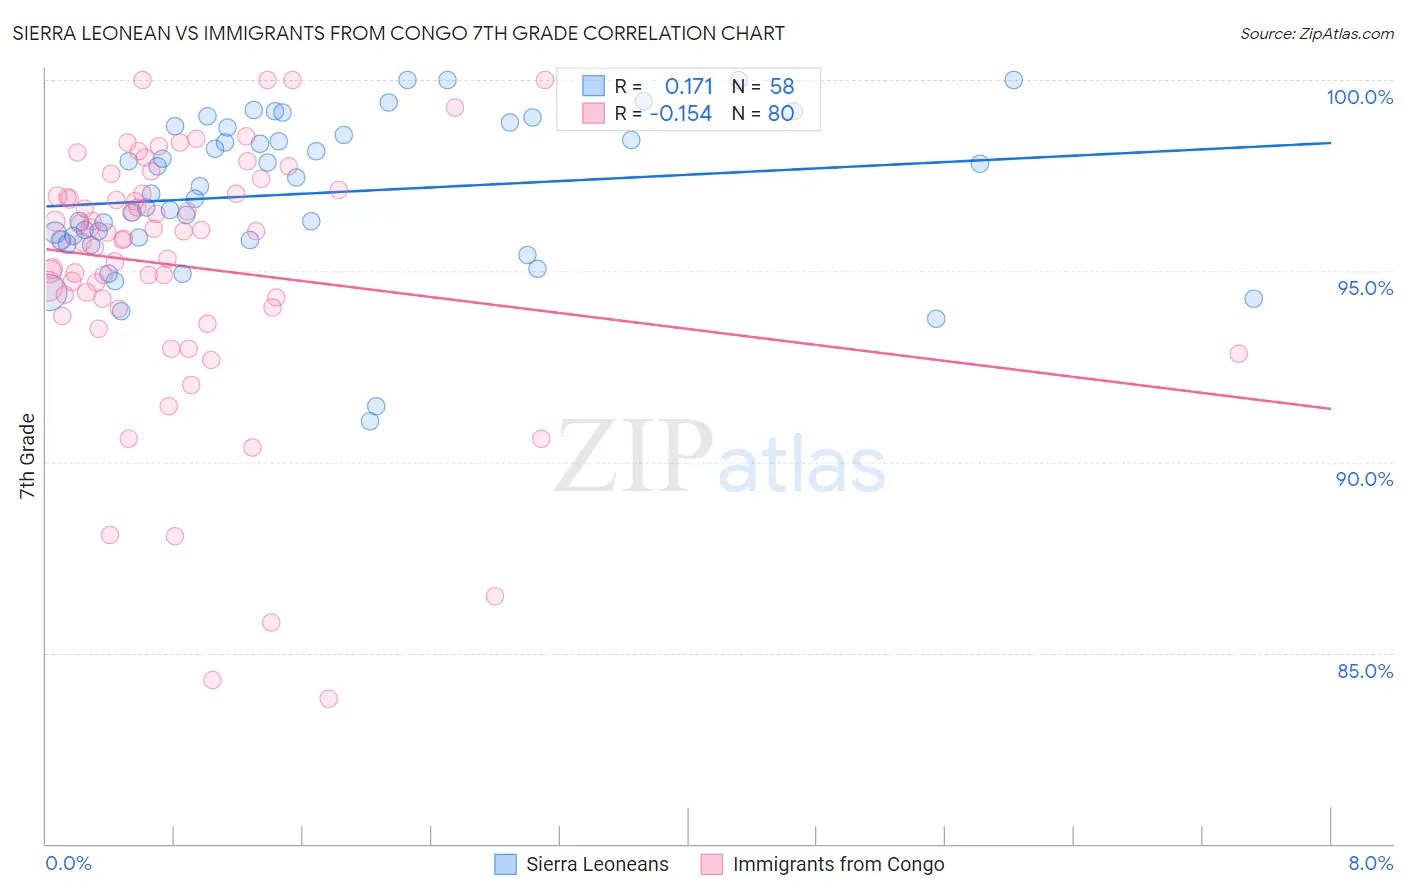
Sierra Leonean vs Immigrants from Congo 7th Grade Correlation Chart
The statistical analysis conducted on geographies consisting of 83,337,655 people shows a poor positive correlation between the proportion of Sierra Leoneans and percentage of population with at least 7th grade education in the United States with a correlation coefficient (R) of 0.171 and weighted average of 96.0%. Similarly, the statistical analysis conducted on geographies consisting of 92,124,753 people shows a poor negative correlation between the proportion of Immigrants from Congo and percentage of population with at least 7th grade education in the United States with a correlation coefficient (R) of -0.154 and weighted average of 95.3%, a difference of 0.68%.
7th Grade Correlation Summary
| Measurement | Sierra Leonean | Immigrants from Congo |
| Minimum | 91.1% | 83.8% |
| Maximum | 100.0% | 100.0% |
| Range | 8.9% | 16.2% |
| Mean | 97.0% | 95.1% |
| Median | 97.1% | 95.9% |
| Interquartile 25% (IQ1) | 95.8% | 94.2% |
| Interquartile 75% (IQ3) | 98.8% | 97.0% |
| Interquartile Range (IQR) | 2.9% | 2.9% |
| Standard Deviation (Sample) | 2.0% | 3.4% |
| Standard Deviation (Population) | 2.0% | 3.4% |
Similar Demographics by 7th Grade
Demographics Similar to Sierra Leoneans by 7th Grade
In terms of 7th grade, the demographic groups most similar to Sierra Leoneans are Brazilian (96.0%, a difference of 0.0%), Immigrants from Spain (96.0%, a difference of 0.010%), Immigrants from Iraq (96.0%, a difference of 0.010%), Immigrants from Uganda (96.0%, a difference of 0.010%), and Iraqi (96.0%, a difference of 0.020%).
| Demographics | Rating | Rank | 7th Grade |
| Immigrants | Korea | 49.2 /100 | #177 | Average 96.0% |
| Marshallese | 48.4 /100 | #178 | Average 96.0% |
| Immigrants | Iran | 47.8 /100 | #179 | Average 96.0% |
| Immigrants | Brazil | 46.8 /100 | #180 | Average 96.0% |
| Pakistanis | 44.5 /100 | #181 | Average 96.0% |
| Iraqis | 41.2 /100 | #182 | Average 96.0% |
| Immigrants | Spain | 38.8 /100 | #183 | Fair 96.0% |
| Sierra Leoneans | 37.5 /100 | #184 | Fair 96.0% |
| Brazilians | 37.3 /100 | #185 | Fair 96.0% |
| Immigrants | Iraq | 36.1 /100 | #186 | Fair 96.0% |
| Immigrants | Uganda | 36.0 /100 | #187 | Fair 96.0% |
| Immigrants | Egypt | 34.3 /100 | #188 | Fair 95.9% |
| Immigrants | Venezuela | 33.9 /100 | #189 | Fair 95.9% |
| Immigrants | Micronesia | 32.6 /100 | #190 | Fair 95.9% |
| Liberians | 32.5 /100 | #191 | Fair 95.9% |
Demographics Similar to Immigrants from Congo by 7th Grade
In terms of 7th grade, the demographic groups most similar to Immigrants from Congo are Immigrants from China (95.3%, a difference of 0.0%), Ghanaian (95.3%, a difference of 0.0%), Korean (95.3%, a difference of 0.010%), Colombian (95.3%, a difference of 0.020%), and Somali (95.3%, a difference of 0.030%).
| Demographics | Rating | Rank | 7th Grade |
| Immigrants | Cameroon | 0.9 /100 | #250 | Tragic 95.4% |
| Immigrants | Jamaica | 0.9 /100 | #251 | Tragic 95.4% |
| Immigrants | Ethiopia | 0.9 /100 | #252 | Tragic 95.3% |
| Somalis | 0.9 /100 | #253 | Tragic 95.3% |
| Colombians | 0.8 /100 | #254 | Tragic 95.3% |
| Koreans | 0.8 /100 | #255 | Tragic 95.3% |
| Immigrants | China | 0.7 /100 | #256 | Tragic 95.3% |
| Immigrants | Congo | 0.7 /100 | #257 | Tragic 95.3% |
| Ghanaians | 0.7 /100 | #258 | Tragic 95.3% |
| Immigrants | Costa Rica | 0.6 /100 | #259 | Tragic 95.3% |
| Afghans | 0.5 /100 | #260 | Tragic 95.3% |
| South Americans | 0.5 /100 | #261 | Tragic 95.2% |
| Immigrants | Somalia | 0.5 /100 | #262 | Tragic 95.2% |
| West Indians | 0.5 /100 | #263 | Tragic 95.2% |
| Immigrants | Nigeria | 0.4 /100 | #264 | Tragic 95.2% |