Lithuanian vs Immigrants from Belize 7th Grade
COMPARE
Lithuanian
Immigrants from Belize
7th Grade
7th Grade Comparison
Lithuanians
Immigrants from Belize
97.5%
7TH GRADE
100.0/ 100
METRIC RATING
19th/ 347
METRIC RANK
93.4%
7TH GRADE
0.0/ 100
METRIC RATING
323rd/ 347
METRIC RANK
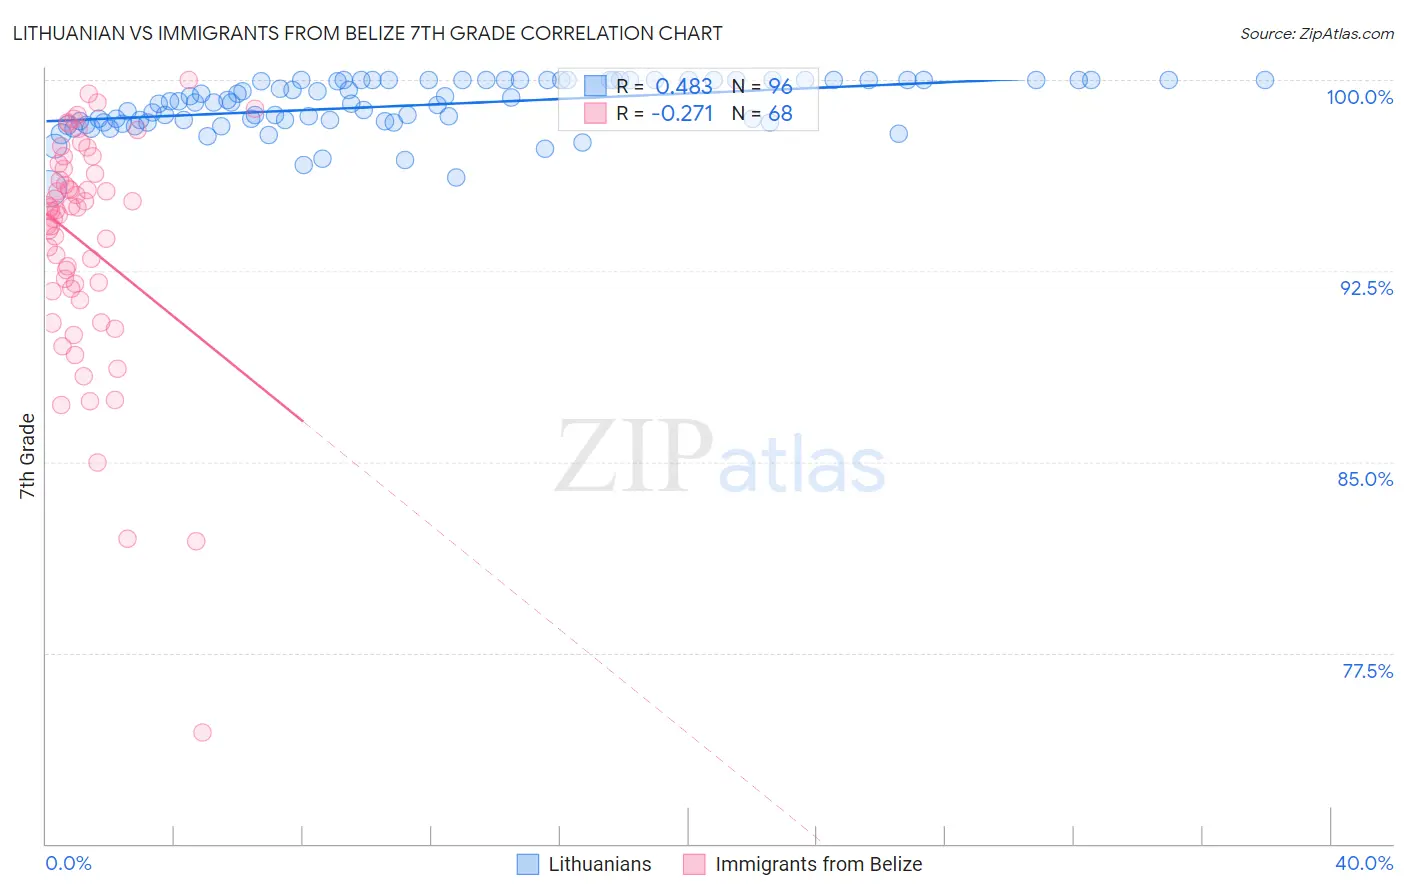
Lithuanian vs Immigrants from Belize 7th Grade Correlation Chart
The statistical analysis conducted on geographies consisting of 421,947,029 people shows a moderate positive correlation between the proportion of Lithuanians and percentage of population with at least 7th grade education in the United States with a correlation coefficient (R) of 0.483 and weighted average of 97.5%. Similarly, the statistical analysis conducted on geographies consisting of 130,181,087 people shows a weak negative correlation between the proportion of Immigrants from Belize and percentage of population with at least 7th grade education in the United States with a correlation coefficient (R) of -0.271 and weighted average of 93.4%, a difference of 4.4%.
7th Grade Correlation Summary
| Measurement | Lithuanian | Immigrants from Belize |
| Minimum | 95.7% | 74.3% |
| Maximum | 100.0% | 100.0% |
| Range | 4.3% | 25.7% |
| Mean | 99.0% | 93.6% |
| Median | 99.1% | 94.9% |
| Interquartile 25% (IQ1) | 98.4% | 91.8% |
| Interquartile 75% (IQ3) | 100.0% | 96.4% |
| Interquartile Range (IQR) | 1.6% | 4.7% |
| Standard Deviation (Sample) | 1.00% | 4.6% |
| Standard Deviation (Population) | 0.99% | 4.5% |
Similar Demographics by 7th Grade
Demographics Similar to Lithuanians by 7th Grade
In terms of 7th grade, the demographic groups most similar to Lithuanians are Tlingit-Haida (97.5%, a difference of 0.010%), Scottish (97.5%, a difference of 0.020%), Irish (97.5%, a difference of 0.030%), Yup'ik (97.4%, a difference of 0.040%), and Inupiat (97.4%, a difference of 0.060%).
| Demographics | Rating | Rank | 7th Grade |
| Poles | 100.0 /100 | #12 | Exceptional 97.6% |
| Swedes | 100.0 /100 | #13 | Exceptional 97.6% |
| Pennsylvania Germans | 100.0 /100 | #14 | Exceptional 97.6% |
| English | 100.0 /100 | #15 | Exceptional 97.6% |
| Irish | 100.0 /100 | #16 | Exceptional 97.5% |
| Scottish | 100.0 /100 | #17 | Exceptional 97.5% |
| Tlingit-Haida | 100.0 /100 | #18 | Exceptional 97.5% |
| Lithuanians | 100.0 /100 | #19 | Exceptional 97.5% |
| Yup'ik | 100.0 /100 | #20 | Exceptional 97.4% |
| Inupiat | 100.0 /100 | #21 | Exceptional 97.4% |
| French Canadians | 100.0 /100 | #22 | Exceptional 97.4% |
| Croatians | 100.0 /100 | #23 | Exceptional 97.4% |
| Welsh | 100.0 /100 | #24 | Exceptional 97.4% |
| French | 100.0 /100 | #25 | Exceptional 97.4% |
| Scotch-Irish | 100.0 /100 | #26 | Exceptional 97.4% |
Demographics Similar to Immigrants from Belize by 7th Grade
In terms of 7th grade, the demographic groups most similar to Immigrants from Belize are Dominican (93.3%, a difference of 0.020%), Central American Indian (93.3%, a difference of 0.080%), Nicaraguan (93.5%, a difference of 0.11%), Belizean (93.5%, a difference of 0.15%), and Immigrants from Fiji (93.5%, a difference of 0.19%).
| Demographics | Rating | Rank | 7th Grade |
| Immigrants | Vietnam | 0.0 /100 | #316 | Tragic 93.9% |
| Immigrants | Cuba | 0.0 /100 | #317 | Tragic 93.8% |
| Immigrants | Ecuador | 0.0 /100 | #318 | Tragic 93.7% |
| Immigrants | Cambodia | 0.0 /100 | #319 | Tragic 93.7% |
| Immigrants | Fiji | 0.0 /100 | #320 | Tragic 93.5% |
| Belizeans | 0.0 /100 | #321 | Tragic 93.5% |
| Nicaraguans | 0.0 /100 | #322 | Tragic 93.5% |
| Immigrants | Belize | 0.0 /100 | #323 | Tragic 93.4% |
| Dominicans | 0.0 /100 | #324 | Tragic 93.3% |
| Central American Indians | 0.0 /100 | #325 | Tragic 93.3% |
| Nepalese | 0.0 /100 | #326 | Tragic 93.2% |
| Immigrants | Cabo Verde | 0.0 /100 | #327 | Tragic 93.1% |
| Immigrants | Nicaragua | 0.0 /100 | #328 | Tragic 93.0% |
| Immigrants | Azores | 0.0 /100 | #329 | Tragic 93.0% |
| Immigrants | Dominican Republic | 0.0 /100 | #330 | Tragic 92.9% |