Immigrants from Venezuela vs Immigrants from Belize 7th Grade
COMPARE
Immigrants from Venezuela
Immigrants from Belize
7th Grade
7th Grade Comparison
Immigrants from Venezuela
Immigrants from Belize
95.9%
7TH GRADE
33.9/ 100
METRIC RATING
189th/ 347
METRIC RANK
93.4%
7TH GRADE
0.0/ 100
METRIC RATING
323rd/ 347
METRIC RANK
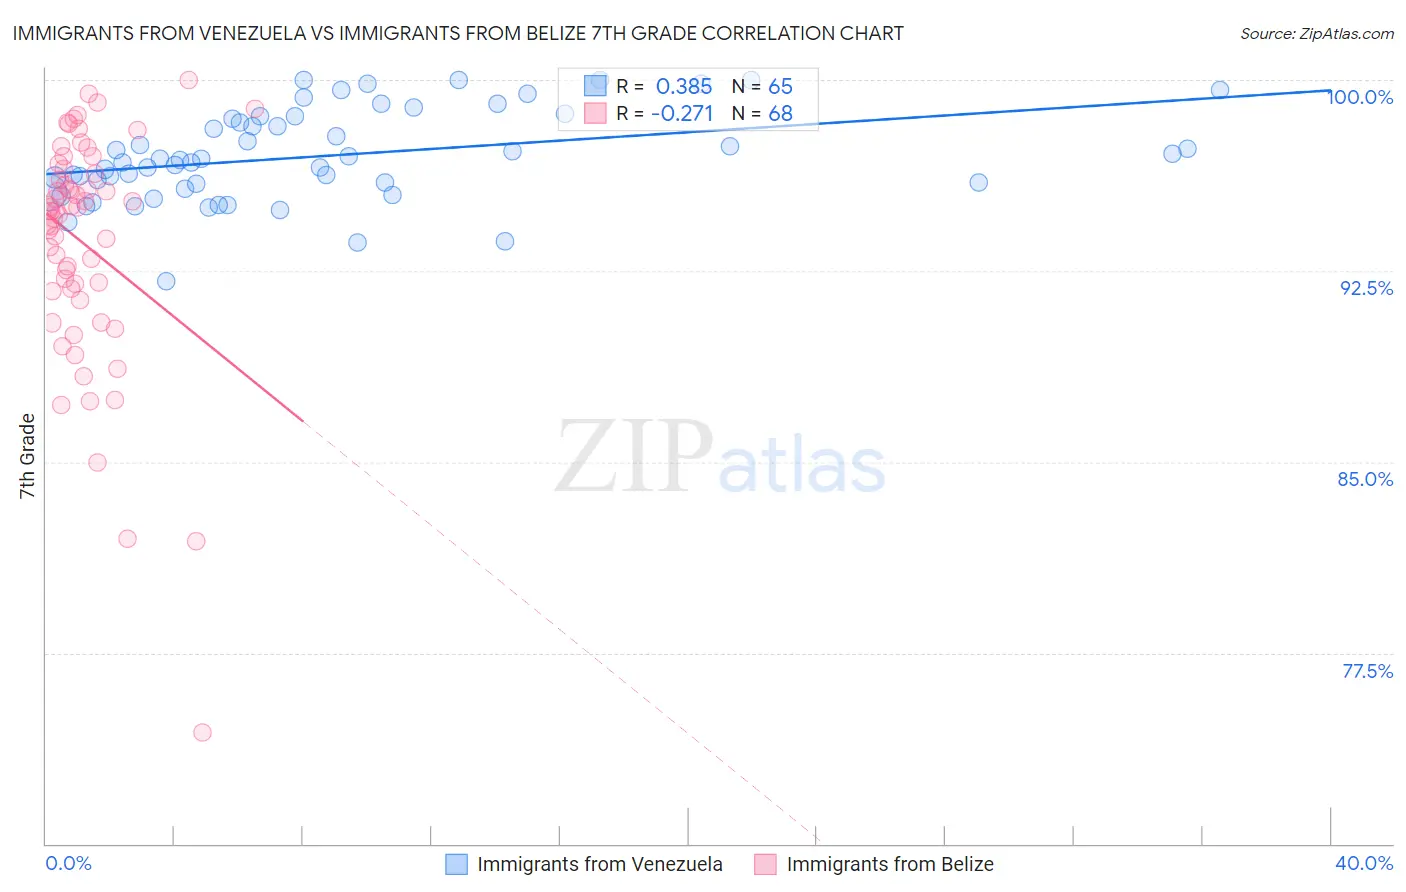
Immigrants from Venezuela vs Immigrants from Belize 7th Grade Correlation Chart
The statistical analysis conducted on geographies consisting of 287,866,009 people shows a mild positive correlation between the proportion of Immigrants from Venezuela and percentage of population with at least 7th grade education in the United States with a correlation coefficient (R) of 0.385 and weighted average of 95.9%. Similarly, the statistical analysis conducted on geographies consisting of 130,181,087 people shows a weak negative correlation between the proportion of Immigrants from Belize and percentage of population with at least 7th grade education in the United States with a correlation coefficient (R) of -0.271 and weighted average of 93.4%, a difference of 2.8%.
7th Grade Correlation Summary
| Measurement | Immigrants from Venezuela | Immigrants from Belize |
| Minimum | 92.1% | 74.3% |
| Maximum | 100.0% | 100.0% |
| Range | 7.9% | 25.7% |
| Mean | 97.0% | 93.6% |
| Median | 96.8% | 94.9% |
| Interquartile 25% (IQ1) | 95.8% | 91.8% |
| Interquartile 75% (IQ3) | 98.5% | 96.4% |
| Interquartile Range (IQR) | 2.7% | 4.7% |
| Standard Deviation (Sample) | 1.8% | 4.6% |
| Standard Deviation (Population) | 1.8% | 4.5% |
Similar Demographics by 7th Grade
Demographics Similar to Immigrants from Venezuela by 7th Grade
In terms of 7th grade, the demographic groups most similar to Immigrants from Venezuela are Immigrants from Egypt (95.9%, a difference of 0.0%), Immigrants from Iraq (96.0%, a difference of 0.010%), Immigrants from Uganda (96.0%, a difference of 0.010%), Immigrants from Micronesia (95.9%, a difference of 0.010%), and Liberian (95.9%, a difference of 0.010%).
| Demographics | Rating | Rank | 7th Grade |
| Iraqis | 41.2 /100 | #182 | Average 96.0% |
| Immigrants | Spain | 38.8 /100 | #183 | Fair 96.0% |
| Sierra Leoneans | 37.5 /100 | #184 | Fair 96.0% |
| Brazilians | 37.3 /100 | #185 | Fair 96.0% |
| Immigrants | Iraq | 36.1 /100 | #186 | Fair 96.0% |
| Immigrants | Uganda | 36.0 /100 | #187 | Fair 96.0% |
| Immigrants | Egypt | 34.3 /100 | #188 | Fair 95.9% |
| Immigrants | Venezuela | 33.9 /100 | #189 | Fair 95.9% |
| Immigrants | Micronesia | 32.6 /100 | #190 | Fair 95.9% |
| Liberians | 32.5 /100 | #191 | Fair 95.9% |
| Panamanians | 32.3 /100 | #192 | Fair 95.9% |
| Immigrants | Bahamas | 30.8 /100 | #193 | Fair 95.9% |
| Immigrants | Nepal | 30.0 /100 | #194 | Fair 95.9% |
| Sudanese | 28.1 /100 | #195 | Fair 95.9% |
| Apache | 27.6 /100 | #196 | Fair 95.9% |
Demographics Similar to Immigrants from Belize by 7th Grade
In terms of 7th grade, the demographic groups most similar to Immigrants from Belize are Dominican (93.3%, a difference of 0.020%), Central American Indian (93.3%, a difference of 0.080%), Nicaraguan (93.5%, a difference of 0.11%), Belizean (93.5%, a difference of 0.15%), and Immigrants from Fiji (93.5%, a difference of 0.19%).
| Demographics | Rating | Rank | 7th Grade |
| Immigrants | Vietnam | 0.0 /100 | #316 | Tragic 93.9% |
| Immigrants | Cuba | 0.0 /100 | #317 | Tragic 93.8% |
| Immigrants | Ecuador | 0.0 /100 | #318 | Tragic 93.7% |
| Immigrants | Cambodia | 0.0 /100 | #319 | Tragic 93.7% |
| Immigrants | Fiji | 0.0 /100 | #320 | Tragic 93.5% |
| Belizeans | 0.0 /100 | #321 | Tragic 93.5% |
| Nicaraguans | 0.0 /100 | #322 | Tragic 93.5% |
| Immigrants | Belize | 0.0 /100 | #323 | Tragic 93.4% |
| Dominicans | 0.0 /100 | #324 | Tragic 93.3% |
| Central American Indians | 0.0 /100 | #325 | Tragic 93.3% |
| Nepalese | 0.0 /100 | #326 | Tragic 93.2% |
| Immigrants | Cabo Verde | 0.0 /100 | #327 | Tragic 93.1% |
| Immigrants | Nicaragua | 0.0 /100 | #328 | Tragic 93.0% |
| Immigrants | Azores | 0.0 /100 | #329 | Tragic 93.0% |
| Immigrants | Dominican Republic | 0.0 /100 | #330 | Tragic 92.9% |