Sierra Leonean vs Immigrants from Latvia 7th Grade
COMPARE
Sierra Leonean
Immigrants from Latvia
7th Grade
7th Grade Comparison
Sierra Leoneans
Immigrants from Latvia
96.0%
7TH GRADE
37.5/ 100
METRIC RATING
184th/ 347
METRIC RANK
96.6%
7TH GRADE
97.4/ 100
METRIC RATING
111th/ 347
METRIC RANK
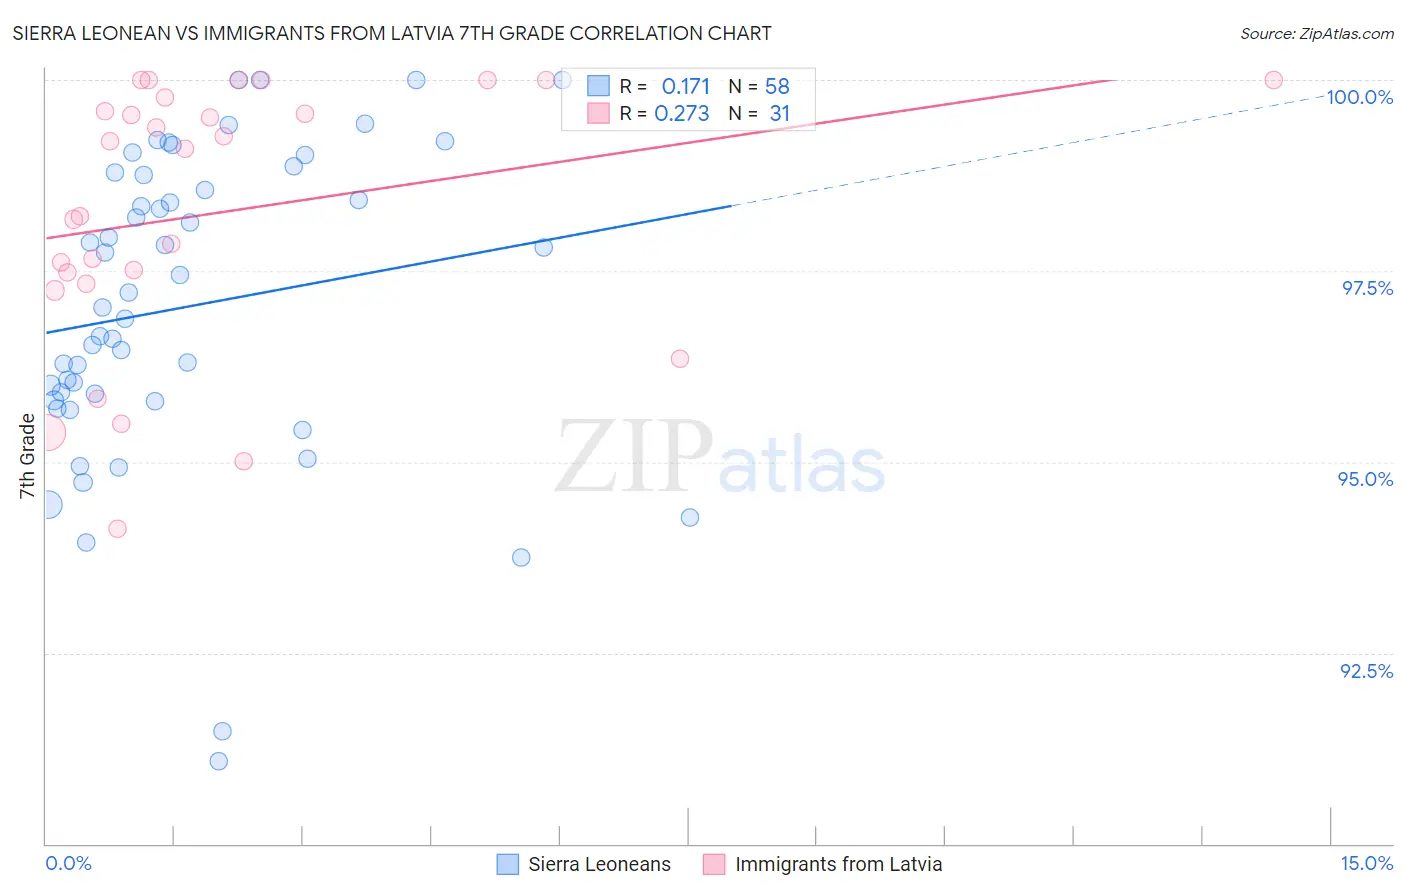
Sierra Leonean vs Immigrants from Latvia 7th Grade Correlation Chart
The statistical analysis conducted on geographies consisting of 83,337,655 people shows a poor positive correlation between the proportion of Sierra Leoneans and percentage of population with at least 7th grade education in the United States with a correlation coefficient (R) of 0.171 and weighted average of 96.0%. Similarly, the statistical analysis conducted on geographies consisting of 113,735,345 people shows a weak positive correlation between the proportion of Immigrants from Latvia and percentage of population with at least 7th grade education in the United States with a correlation coefficient (R) of 0.273 and weighted average of 96.6%, a difference of 0.63%.
7th Grade Correlation Summary
| Measurement | Sierra Leonean | Immigrants from Latvia |
| Minimum | 91.1% | 94.1% |
| Maximum | 100.0% | 100.0% |
| Range | 8.9% | 5.9% |
| Mean | 97.0% | 98.3% |
| Median | 97.1% | 99.1% |
| Interquartile 25% (IQ1) | 95.8% | 97.3% |
| Interquartile 75% (IQ3) | 98.8% | 99.8% |
| Interquartile Range (IQR) | 2.9% | 2.4% |
| Standard Deviation (Sample) | 2.0% | 1.7% |
| Standard Deviation (Population) | 2.0% | 1.7% |
Similar Demographics by 7th Grade
Demographics Similar to Sierra Leoneans by 7th Grade
In terms of 7th grade, the demographic groups most similar to Sierra Leoneans are Brazilian (96.0%, a difference of 0.0%), Immigrants from Spain (96.0%, a difference of 0.010%), Immigrants from Iraq (96.0%, a difference of 0.010%), Immigrants from Uganda (96.0%, a difference of 0.010%), and Iraqi (96.0%, a difference of 0.020%).
| Demographics | Rating | Rank | 7th Grade |
| Immigrants | Korea | 49.2 /100 | #177 | Average 96.0% |
| Marshallese | 48.4 /100 | #178 | Average 96.0% |
| Immigrants | Iran | 47.8 /100 | #179 | Average 96.0% |
| Immigrants | Brazil | 46.8 /100 | #180 | Average 96.0% |
| Pakistanis | 44.5 /100 | #181 | Average 96.0% |
| Iraqis | 41.2 /100 | #182 | Average 96.0% |
| Immigrants | Spain | 38.8 /100 | #183 | Fair 96.0% |
| Sierra Leoneans | 37.5 /100 | #184 | Fair 96.0% |
| Brazilians | 37.3 /100 | #185 | Fair 96.0% |
| Immigrants | Iraq | 36.1 /100 | #186 | Fair 96.0% |
| Immigrants | Uganda | 36.0 /100 | #187 | Fair 96.0% |
| Immigrants | Egypt | 34.3 /100 | #188 | Fair 95.9% |
| Immigrants | Venezuela | 33.9 /100 | #189 | Fair 95.9% |
| Immigrants | Micronesia | 32.6 /100 | #190 | Fair 95.9% |
| Liberians | 32.5 /100 | #191 | Fair 95.9% |
Demographics Similar to Immigrants from Latvia by 7th Grade
In terms of 7th grade, the demographic groups most similar to Immigrants from Latvia are Okinawan (96.6%, a difference of 0.0%), Bhutanese (96.6%, a difference of 0.020%), Nonimmigrants (96.5%, a difference of 0.020%), Lumbee (96.6%, a difference of 0.030%), and Immigrants from Saudi Arabia (96.6%, a difference of 0.030%).
| Demographics | Rating | Rank | 7th Grade |
| Shoshone | 98.1 /100 | #104 | Exceptional 96.6% |
| South Africans | 98.0 /100 | #105 | Exceptional 96.6% |
| Iroquois | 97.9 /100 | #106 | Exceptional 96.6% |
| Lumbee | 97.8 /100 | #107 | Exceptional 96.6% |
| Immigrants | Saudi Arabia | 97.8 /100 | #108 | Exceptional 96.6% |
| Bhutanese | 97.7 /100 | #109 | Exceptional 96.6% |
| Okinawans | 97.4 /100 | #110 | Exceptional 96.6% |
| Immigrants | Latvia | 97.4 /100 | #111 | Exceptional 96.6% |
| Immigrants | Nonimmigrants | 97.0 /100 | #112 | Exceptional 96.5% |
| Pueblo | 96.8 /100 | #113 | Exceptional 96.5% |
| Immigrants | Zimbabwe | 96.6 /100 | #114 | Exceptional 96.5% |
| Choctaw | 96.6 /100 | #115 | Exceptional 96.5% |
| Syrians | 96.6 /100 | #116 | Exceptional 96.5% |
| Immigrants | Moldova | 95.7 /100 | #117 | Exceptional 96.5% |
| Immigrants | Japan | 95.5 /100 | #118 | Exceptional 96.5% |