Sierra Leonean vs Immigrants from Belize In Labor Force | Age 16-19
COMPARE
Sierra Leonean
Immigrants from Belize
In Labor Force | Age 16-19
In Labor Force | Age 16-19 Comparison
Sierra Leoneans
Immigrants from Belize
37.6%
IN LABOR FORCE | AGE 16-19
89.7/ 100
METRIC RATING
142nd/ 347
METRIC RANK
31.8%
IN LABOR FORCE | AGE 16-19
0.0/ 100
METRIC RATING
312th/ 347
METRIC RANK
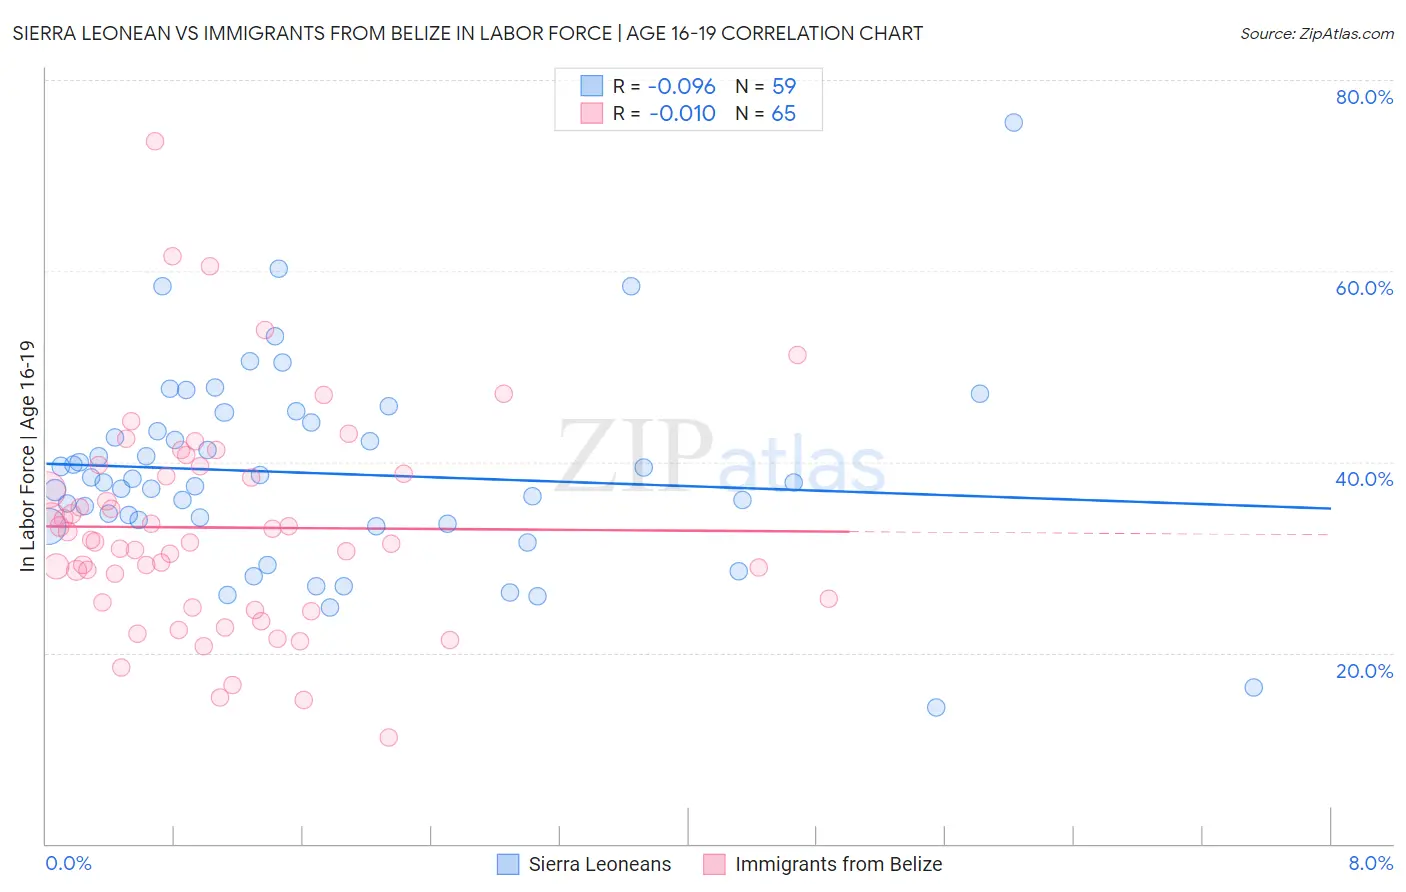
Sierra Leonean vs Immigrants from Belize In Labor Force | Age 16-19 Correlation Chart
The statistical analysis conducted on geographies consisting of 83,336,332 people shows a slight negative correlation between the proportion of Sierra Leoneans and labor force participation rate among population between the ages 16 and 19 in the United States with a correlation coefficient (R) of -0.096 and weighted average of 37.6%. Similarly, the statistical analysis conducted on geographies consisting of 130,258,278 people shows no correlation between the proportion of Immigrants from Belize and labor force participation rate among population between the ages 16 and 19 in the United States with a correlation coefficient (R) of -0.010 and weighted average of 31.8%, a difference of 18.1%.
In Labor Force | Age 16-19 Correlation Summary
| Measurement | Sierra Leonean | Immigrants from Belize |
| Minimum | 14.3% | 11.1% |
| Maximum | 75.6% | 73.6% |
| Range | 61.3% | 62.5% |
| Mean | 38.8% | 33.1% |
| Median | 37.8% | 31.6% |
| Interquartile 25% (IQ1) | 33.5% | 25.0% |
| Interquartile 75% (IQ3) | 44.1% | 39.1% |
| Interquartile Range (IQR) | 10.6% | 14.1% |
| Standard Deviation (Sample) | 10.4% | 11.4% |
| Standard Deviation (Population) | 10.3% | 11.3% |
Similar Demographics by In Labor Force | Age 16-19
Demographics Similar to Sierra Leoneans by In Labor Force | Age 16-19
In terms of in labor force | age 16-19, the demographic groups most similar to Sierra Leoneans are Pakistani (37.6%, a difference of 0.030%), Japanese (37.5%, a difference of 0.050%), Paiute (37.5%, a difference of 0.050%), Immigrants from Western Europe (37.5%, a difference of 0.10%), and Brazilian (37.5%, a difference of 0.13%).
| Demographics | Rating | Rank | In Labor Force | Age 16-19 |
| Macedonians | 93.4 /100 | #135 | Exceptional 37.8% |
| Australians | 93.2 /100 | #136 | Exceptional 37.8% |
| Cajuns | 93.2 /100 | #137 | Exceptional 37.8% |
| Comanche | 91.9 /100 | #138 | Exceptional 37.7% |
| Immigrants | Moldova | 91.9 /100 | #139 | Exceptional 37.7% |
| Estonians | 91.7 /100 | #140 | Exceptional 37.7% |
| Syrians | 90.7 /100 | #141 | Exceptional 37.6% |
| Sierra Leoneans | 89.7 /100 | #142 | Excellent 37.6% |
| Pakistanis | 89.5 /100 | #143 | Excellent 37.6% |
| Japanese | 89.3 /100 | #144 | Excellent 37.5% |
| Paiute | 89.3 /100 | #145 | Excellent 37.5% |
| Immigrants | Western Europe | 88.9 /100 | #146 | Excellent 37.5% |
| Brazilians | 88.7 /100 | #147 | Excellent 37.5% |
| Romanians | 87.3 /100 | #148 | Excellent 37.5% |
| Native Hawaiians | 85.0 /100 | #149 | Excellent 37.4% |
Demographics Similar to Immigrants from Belize by In Labor Force | Age 16-19
In terms of in labor force | age 16-19, the demographic groups most similar to Immigrants from Belize are Hopi (31.8%, a difference of 0.010%), Indian (Asian) (31.9%, a difference of 0.14%), Cuban (31.8%, a difference of 0.16%), Immigrants from West Indies (31.7%, a difference of 0.34%), and Filipino (31.7%, a difference of 0.43%).
| Demographics | Rating | Rank | In Labor Force | Age 16-19 |
| Nicaraguans | 0.0 /100 | #305 | Tragic 32.4% |
| Spanish American Indians | 0.0 /100 | #306 | Tragic 32.4% |
| Immigrants | Jamaica | 0.0 /100 | #307 | Tragic 32.2% |
| Navajo | 0.0 /100 | #308 | Tragic 32.1% |
| Immigrants | Eastern Asia | 0.0 /100 | #309 | Tragic 32.0% |
| Immigrants | Iran | 0.0 /100 | #310 | Tragic 32.0% |
| Indians (Asian) | 0.0 /100 | #311 | Tragic 31.9% |
| Immigrants | Belize | 0.0 /100 | #312 | Tragic 31.8% |
| Hopi | 0.0 /100 | #313 | Tragic 31.8% |
| Cubans | 0.0 /100 | #314 | Tragic 31.8% |
| Immigrants | West Indies | 0.0 /100 | #315 | Tragic 31.7% |
| Filipinos | 0.0 /100 | #316 | Tragic 31.7% |
| Immigrants | Nicaragua | 0.0 /100 | #317 | Tragic 31.6% |
| Immigrants | Yemen | 0.0 /100 | #318 | Tragic 31.5% |
| Soviet Union | 0.0 /100 | #319 | Tragic 31.4% |