Argentinean vs Immigrants from Belize 7th Grade
COMPARE
Argentinean
Immigrants from Belize
7th Grade
7th Grade Comparison
Argentineans
Immigrants from Belize
95.9%
7TH GRADE
23.2/ 100
METRIC RATING
200th/ 347
METRIC RANK
93.4%
7TH GRADE
0.0/ 100
METRIC RATING
323rd/ 347
METRIC RANK
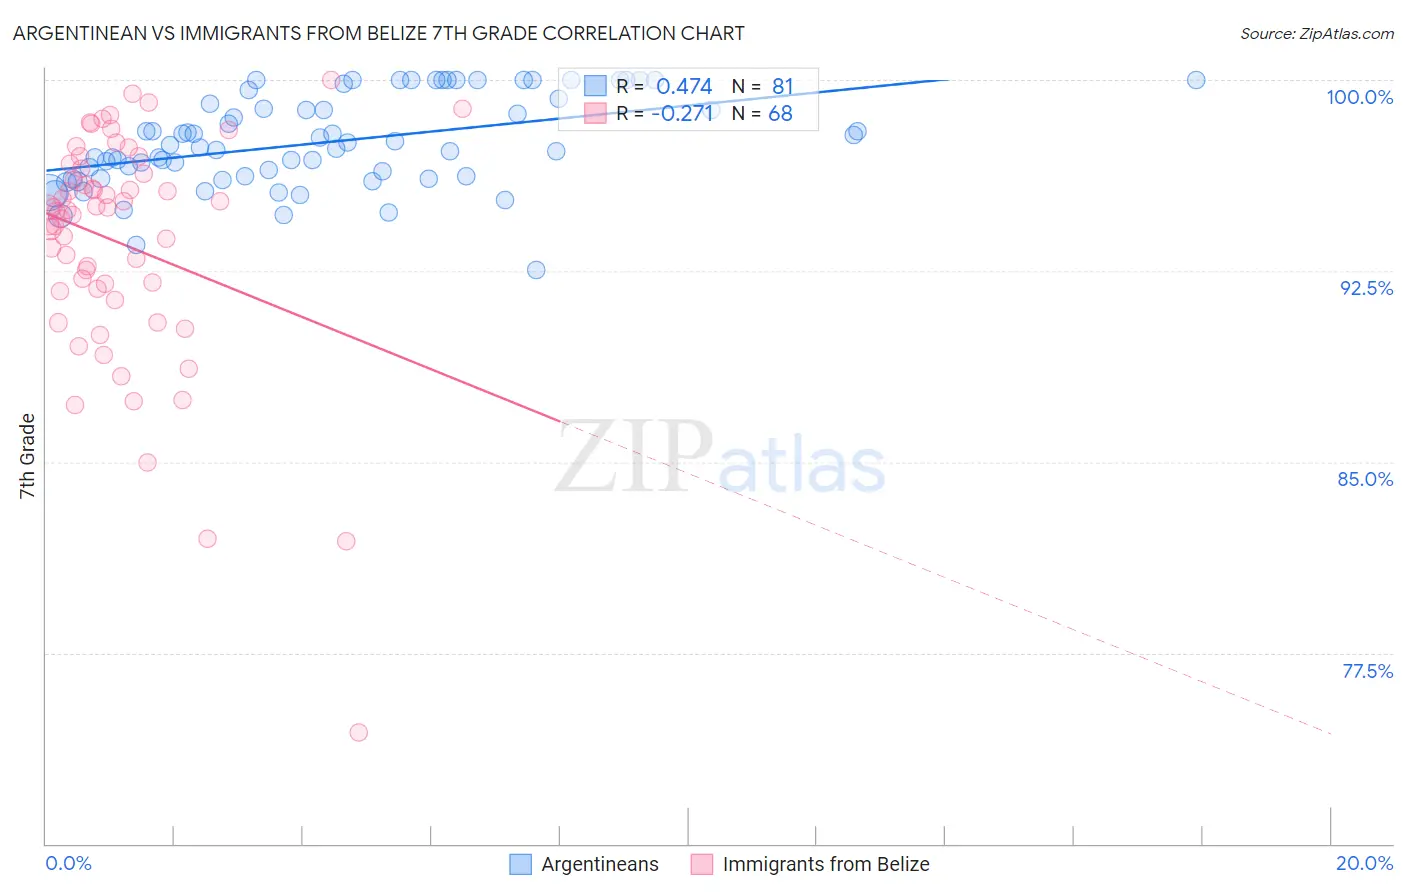
Argentinean vs Immigrants from Belize 7th Grade Correlation Chart
The statistical analysis conducted on geographies consisting of 297,141,515 people shows a moderate positive correlation between the proportion of Argentineans and percentage of population with at least 7th grade education in the United States with a correlation coefficient (R) of 0.474 and weighted average of 95.9%. Similarly, the statistical analysis conducted on geographies consisting of 130,181,087 people shows a weak negative correlation between the proportion of Immigrants from Belize and percentage of population with at least 7th grade education in the United States with a correlation coefficient (R) of -0.271 and weighted average of 93.4%, a difference of 2.7%.
7th Grade Correlation Summary
| Measurement | Argentinean | Immigrants from Belize |
| Minimum | 92.5% | 74.3% |
| Maximum | 100.0% | 100.0% |
| Range | 7.5% | 25.7% |
| Mean | 97.6% | 93.6% |
| Median | 97.4% | 94.9% |
| Interquartile 25% (IQ1) | 96.2% | 91.8% |
| Interquartile 75% (IQ3) | 99.2% | 96.4% |
| Interquartile Range (IQR) | 3.0% | 4.7% |
| Standard Deviation (Sample) | 1.8% | 4.6% |
| Standard Deviation (Population) | 1.8% | 4.5% |
Similar Demographics by 7th Grade
Demographics Similar to Argentineans by 7th Grade
In terms of 7th grade, the demographic groups most similar to Argentineans are Guamanian/Chamorro (95.9%, a difference of 0.0%), Paraguayan (95.9%, a difference of 0.010%), Immigrants from Argentina (95.9%, a difference of 0.010%), Immigrants from Northern Africa (95.8%, a difference of 0.020%), and Comanche (95.8%, a difference of 0.020%).
| Demographics | Rating | Rank | 7th Grade |
| Immigrants | Bahamas | 30.8 /100 | #193 | Fair 95.9% |
| Immigrants | Nepal | 30.0 /100 | #194 | Fair 95.9% |
| Sudanese | 28.1 /100 | #195 | Fair 95.9% |
| Apache | 27.6 /100 | #196 | Fair 95.9% |
| Immigrants | Zaire | 26.7 /100 | #197 | Fair 95.9% |
| Paraguayans | 24.8 /100 | #198 | Fair 95.9% |
| Guamanians/Chamorros | 23.5 /100 | #199 | Fair 95.9% |
| Argentineans | 23.2 /100 | #200 | Fair 95.9% |
| Immigrants | Argentina | 21.9 /100 | #201 | Fair 95.9% |
| Immigrants | Northern Africa | 21.4 /100 | #202 | Fair 95.8% |
| Comanche | 21.1 /100 | #203 | Fair 95.8% |
| Assyrians/Chaldeans/Syriacs | 20.5 /100 | #204 | Fair 95.8% |
| Moroccans | 18.9 /100 | #205 | Poor 95.8% |
| Africans | 17.6 /100 | #206 | Poor 95.8% |
| Navajo | 17.0 /100 | #207 | Poor 95.8% |
Demographics Similar to Immigrants from Belize by 7th Grade
In terms of 7th grade, the demographic groups most similar to Immigrants from Belize are Dominican (93.3%, a difference of 0.020%), Central American Indian (93.3%, a difference of 0.080%), Nicaraguan (93.5%, a difference of 0.11%), Belizean (93.5%, a difference of 0.15%), and Immigrants from Fiji (93.5%, a difference of 0.19%).
| Demographics | Rating | Rank | 7th Grade |
| Immigrants | Vietnam | 0.0 /100 | #316 | Tragic 93.9% |
| Immigrants | Cuba | 0.0 /100 | #317 | Tragic 93.8% |
| Immigrants | Ecuador | 0.0 /100 | #318 | Tragic 93.7% |
| Immigrants | Cambodia | 0.0 /100 | #319 | Tragic 93.7% |
| Immigrants | Fiji | 0.0 /100 | #320 | Tragic 93.5% |
| Belizeans | 0.0 /100 | #321 | Tragic 93.5% |
| Nicaraguans | 0.0 /100 | #322 | Tragic 93.5% |
| Immigrants | Belize | 0.0 /100 | #323 | Tragic 93.4% |
| Dominicans | 0.0 /100 | #324 | Tragic 93.3% |
| Central American Indians | 0.0 /100 | #325 | Tragic 93.3% |
| Nepalese | 0.0 /100 | #326 | Tragic 93.2% |
| Immigrants | Cabo Verde | 0.0 /100 | #327 | Tragic 93.1% |
| Immigrants | Nicaragua | 0.0 /100 | #328 | Tragic 93.0% |
| Immigrants | Azores | 0.0 /100 | #329 | Tragic 93.0% |
| Immigrants | Dominican Republic | 0.0 /100 | #330 | Tragic 92.9% |