Sierra Leonean vs Immigrants from Asia Single Mother Households
COMPARE
Sierra Leonean
Immigrants from Asia
Single Mother Households
Single Mother Households Comparison
Sierra Leoneans
Immigrants from Asia
7.7%
SINGLE MOTHER HOUSEHOLDS
0.0/ 100
METRIC RATING
288th/ 347
METRIC RANK
5.6%
SINGLE MOTHER HOUSEHOLDS
98.4/ 100
METRIC RATING
73rd/ 347
METRIC RANK
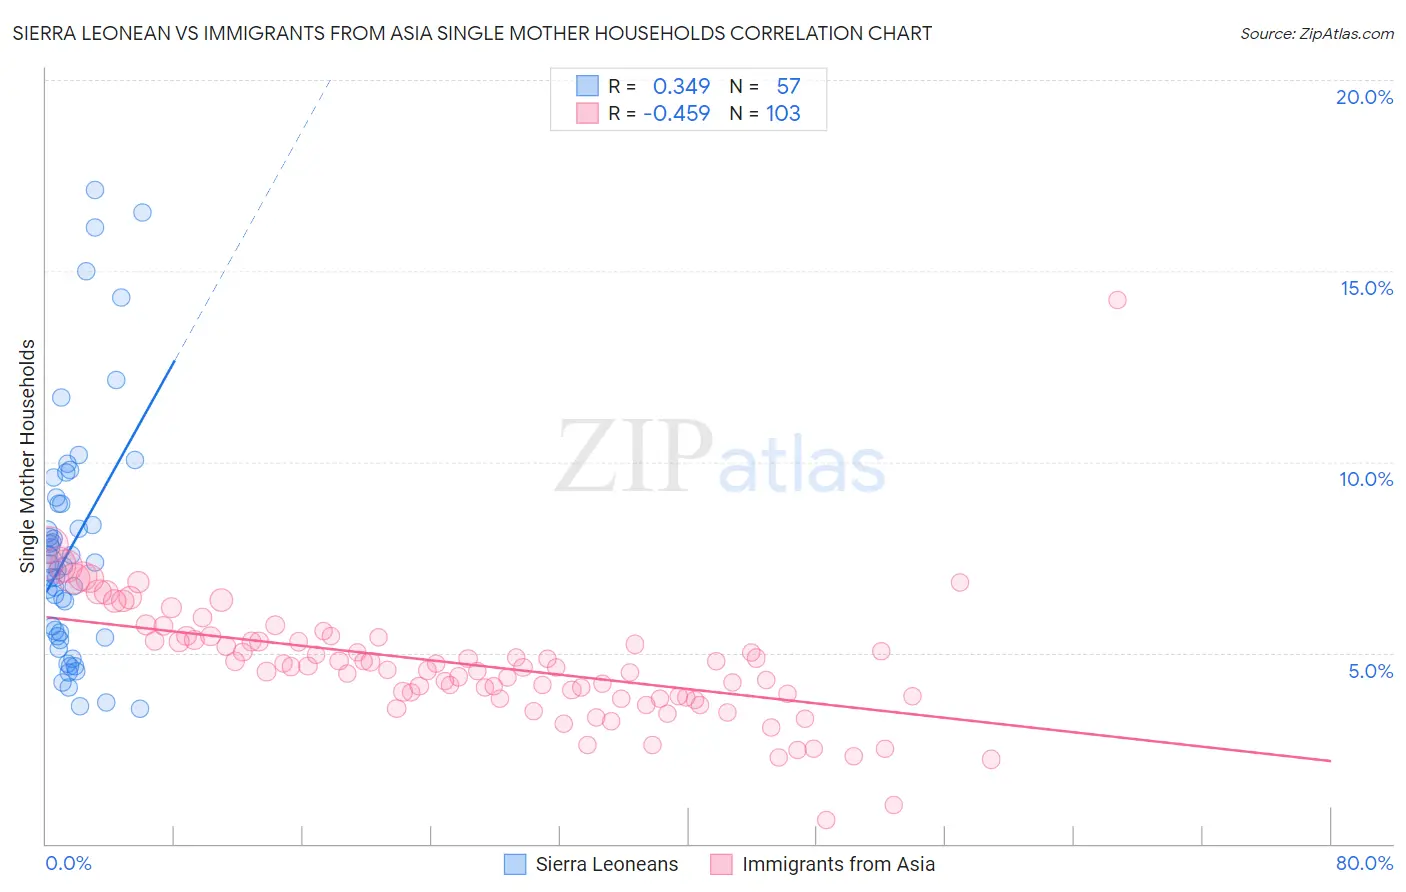
Sierra Leonean vs Immigrants from Asia Single Mother Households Correlation Chart
The statistical analysis conducted on geographies consisting of 83,310,522 people shows a mild positive correlation between the proportion of Sierra Leoneans and percentage of single mother households in the United States with a correlation coefficient (R) of 0.349 and weighted average of 7.7%. Similarly, the statistical analysis conducted on geographies consisting of 545,444,216 people shows a moderate negative correlation between the proportion of Immigrants from Asia and percentage of single mother households in the United States with a correlation coefficient (R) of -0.459 and weighted average of 5.6%, a difference of 38.0%.
Single Mother Households Correlation Summary
| Measurement | Sierra Leonean | Immigrants from Asia |
| Minimum | 3.5% | 0.63% |
| Maximum | 17.1% | 14.2% |
| Range | 13.6% | 13.6% |
| Mean | 7.8% | 4.7% |
| Median | 7.3% | 4.6% |
| Interquartile 25% (IQ1) | 5.4% | 3.8% |
| Interquartile 75% (IQ3) | 9.0% | 5.3% |
| Interquartile Range (IQR) | 3.6% | 1.5% |
| Standard Deviation (Sample) | 3.2% | 1.6% |
| Standard Deviation (Population) | 3.2% | 1.6% |
Similar Demographics by Single Mother Households
Demographics Similar to Sierra Leoneans by Single Mother Households
In terms of single mother households, the demographic groups most similar to Sierra Leoneans are Immigrants from Guatemala (7.7%, a difference of 0.050%), Immigrants from Middle Africa (7.7%, a difference of 0.15%), Trinidadian and Tobagonian (7.7%, a difference of 0.26%), Immigrants from Belize (7.7%, a difference of 0.29%), and Nigerian (7.7%, a difference of 0.89%).
| Demographics | Rating | Rank | Single Mother Households |
| Immigrants | Laos | 0.0 /100 | #281 | Tragic 7.7% |
| Guatemalans | 0.0 /100 | #282 | Tragic 7.7% |
| Nigerians | 0.0 /100 | #283 | Tragic 7.7% |
| Immigrants | Belize | 0.0 /100 | #284 | Tragic 7.7% |
| Trinidadians and Tobagonians | 0.0 /100 | #285 | Tragic 7.7% |
| Immigrants | Middle Africa | 0.0 /100 | #286 | Tragic 7.7% |
| Immigrants | Guatemala | 0.0 /100 | #287 | Tragic 7.7% |
| Sierra Leoneans | 0.0 /100 | #288 | Tragic 7.7% |
| Sub-Saharan Africans | 0.0 /100 | #289 | Tragic 7.8% |
| Immigrants | Nigeria | 0.0 /100 | #290 | Tragic 7.8% |
| West Indians | 0.0 /100 | #291 | Tragic 7.8% |
| Ghanaians | 0.0 /100 | #292 | Tragic 7.8% |
| Immigrants | Cameroon | 0.0 /100 | #293 | Tragic 7.9% |
| Apache | 0.0 /100 | #294 | Tragic 7.9% |
| Barbadians | 0.0 /100 | #295 | Tragic 7.9% |
Demographics Similar to Immigrants from Asia by Single Mother Households
In terms of single mother households, the demographic groups most similar to Immigrants from Asia are Immigrants from North America (5.6%, a difference of 0.030%), Immigrants from Netherlands (5.6%, a difference of 0.060%), Immigrants from Kazakhstan (5.6%, a difference of 0.15%), Immigrants from Eastern Europe (5.6%, a difference of 0.16%), and Slovene (5.6%, a difference of 0.17%).
| Demographics | Rating | Rank | Single Mother Households |
| Immigrants | Canada | 98.5 /100 | #66 | Exceptional 5.6% |
| Italians | 98.5 /100 | #67 | Exceptional 5.6% |
| Immigrants | Bulgaria | 98.5 /100 | #68 | Exceptional 5.6% |
| Asians | 98.5 /100 | #69 | Exceptional 5.6% |
| Immigrants | Eastern Europe | 98.4 /100 | #70 | Exceptional 5.6% |
| Immigrants | Kazakhstan | 98.4 /100 | #71 | Exceptional 5.6% |
| Immigrants | Netherlands | 98.4 /100 | #72 | Exceptional 5.6% |
| Immigrants | Asia | 98.4 /100 | #73 | Exceptional 5.6% |
| Immigrants | North America | 98.3 /100 | #74 | Exceptional 5.6% |
| Slovenes | 98.3 /100 | #75 | Exceptional 5.6% |
| New Zealanders | 98.2 /100 | #76 | Exceptional 5.6% |
| Romanians | 98.1 /100 | #77 | Exceptional 5.6% |
| Swiss | 98.1 /100 | #78 | Exceptional 5.6% |
| Immigrants | Sri Lanka | 98.0 /100 | #79 | Exceptional 5.6% |
| Czechs | 97.9 /100 | #80 | Exceptional 5.6% |