Shoshone vs Immigrants from Germany Master's Degree
COMPARE
Shoshone
Immigrants from Germany
Master's Degree
Master's Degree Comparison
Shoshone
Immigrants from Germany
11.1%
MASTER'S DEGREE
0.0/ 100
METRIC RATING
310th/ 347
METRIC RANK
15.8%
MASTER'S DEGREE
85.9/ 100
METRIC RATING
139th/ 347
METRIC RANK
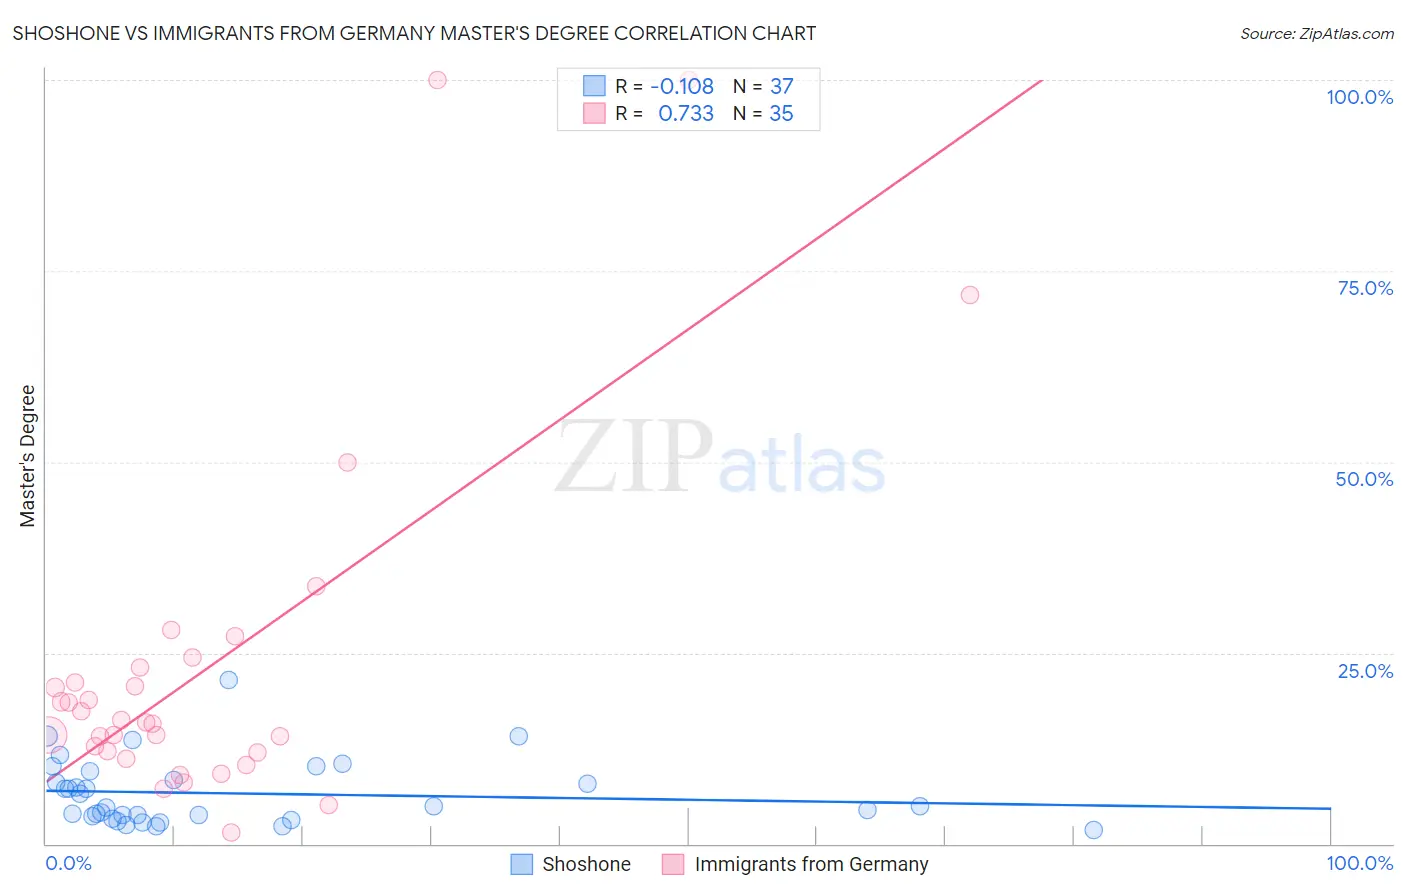
Shoshone vs Immigrants from Germany Master's Degree Correlation Chart
The statistical analysis conducted on geographies consisting of 66,620,223 people shows a poor negative correlation between the proportion of Shoshone and percentage of population with at least master's degree education in the United States with a correlation coefficient (R) of -0.108 and weighted average of 11.1%. Similarly, the statistical analysis conducted on geographies consisting of 463,768,587 people shows a strong positive correlation between the proportion of Immigrants from Germany and percentage of population with at least master's degree education in the United States with a correlation coefficient (R) of 0.733 and weighted average of 15.8%, a difference of 42.2%.
Master's Degree Correlation Summary
| Measurement | Shoshone | Immigrants from Germany |
| Minimum | 1.8% | 1.5% |
| Maximum | 21.5% | 100.0% |
| Range | 19.7% | 98.5% |
| Mean | 6.6% | 23.2% |
| Median | 4.9% | 15.9% |
| Interquartile 25% (IQ1) | 3.4% | 11.9% |
| Interquartile 75% (IQ3) | 8.9% | 23.0% |
| Interquartile Range (IQR) | 5.5% | 11.1% |
| Standard Deviation (Sample) | 4.3% | 23.1% |
| Standard Deviation (Population) | 4.3% | 22.7% |
Similar Demographics by Master's Degree
Demographics Similar to Shoshone by Master's Degree
In terms of master's degree, the demographic groups most similar to Shoshone are Puget Sound Salish (11.1%, a difference of 0.36%), Seminole (11.0%, a difference of 0.51%), Choctaw (11.0%, a difference of 0.61%), Puerto Rican (11.2%, a difference of 0.65%), and Yaqui (11.0%, a difference of 0.79%).
| Demographics | Rating | Rank | Master's Degree |
| Immigrants | Laos | 0.1 /100 | #303 | Tragic 11.4% |
| Immigrants | Cabo Verde | 0.1 /100 | #304 | Tragic 11.3% |
| Immigrants | Latin America | 0.0 /100 | #305 | Tragic 11.3% |
| Mexican American Indians | 0.0 /100 | #306 | Tragic 11.2% |
| Cheyenne | 0.0 /100 | #307 | Tragic 11.2% |
| Puerto Ricans | 0.0 /100 | #308 | Tragic 11.2% |
| Puget Sound Salish | 0.0 /100 | #309 | Tragic 11.1% |
| Shoshone | 0.0 /100 | #310 | Tragic 11.1% |
| Seminole | 0.0 /100 | #311 | Tragic 11.0% |
| Choctaw | 0.0 /100 | #312 | Tragic 11.0% |
| Yaqui | 0.0 /100 | #313 | Tragic 11.0% |
| Cajuns | 0.0 /100 | #314 | Tragic 11.0% |
| Apache | 0.0 /100 | #315 | Tragic 11.0% |
| Hispanics or Latinos | 0.0 /100 | #316 | Tragic 10.9% |
| Hopi | 0.0 /100 | #317 | Tragic 10.9% |
Demographics Similar to Immigrants from Germany by Master's Degree
In terms of master's degree, the demographic groups most similar to Immigrants from Germany are Pakistani (15.8%, a difference of 0.060%), Vietnamese (15.8%, a difference of 0.090%), European (15.8%, a difference of 0.14%), Polish (15.7%, a difference of 0.21%), and Assyrian/Chaldean/Syriac (15.8%, a difference of 0.24%).
| Demographics | Rating | Rank | Master's Degree |
| Serbians | 91.7 /100 | #132 | Exceptional 16.1% |
| Immigrants | Sudan | 90.2 /100 | #133 | Exceptional 16.0% |
| Venezuelans | 88.4 /100 | #134 | Excellent 15.9% |
| South American Indians | 88.4 /100 | #135 | Excellent 15.9% |
| Assyrians/Chaldeans/Syriacs | 86.8 /100 | #136 | Excellent 15.8% |
| Europeans | 86.4 /100 | #137 | Excellent 15.8% |
| Pakistanis | 86.1 /100 | #138 | Excellent 15.8% |
| Immigrants | Germany | 85.9 /100 | #139 | Excellent 15.8% |
| Vietnamese | 85.5 /100 | #140 | Excellent 15.8% |
| Poles | 85.0 /100 | #141 | Excellent 15.7% |
| Immigrants | Africa | 84.0 /100 | #142 | Excellent 15.7% |
| Immigrants | Venezuela | 83.6 /100 | #143 | Excellent 15.7% |
| Canadians | 83.3 /100 | #144 | Excellent 15.7% |
| South Americans | 81.3 /100 | #145 | Excellent 15.6% |
| Immigrants | Afghanistan | 79.4 /100 | #146 | Good 15.6% |