Serbian vs Immigrants from Taiwan Unemployment Among Ages 65 to 74 years
COMPARE
Serbian
Immigrants from Taiwan
Unemployment Among Ages 65 to 74 years
Unemployment Among Ages 65 to 74 years Comparison
Serbians
Immigrants from Taiwan
5.2%
UNEMPLOYMENT AMONG AGES 65 TO 74 YEARS
97.0/ 100
METRIC RATING
95th/ 347
METRIC RANK
5.1%
UNEMPLOYMENT AMONG AGES 65 TO 74 YEARS
99.4/ 100
METRIC RATING
61st/ 347
METRIC RANK
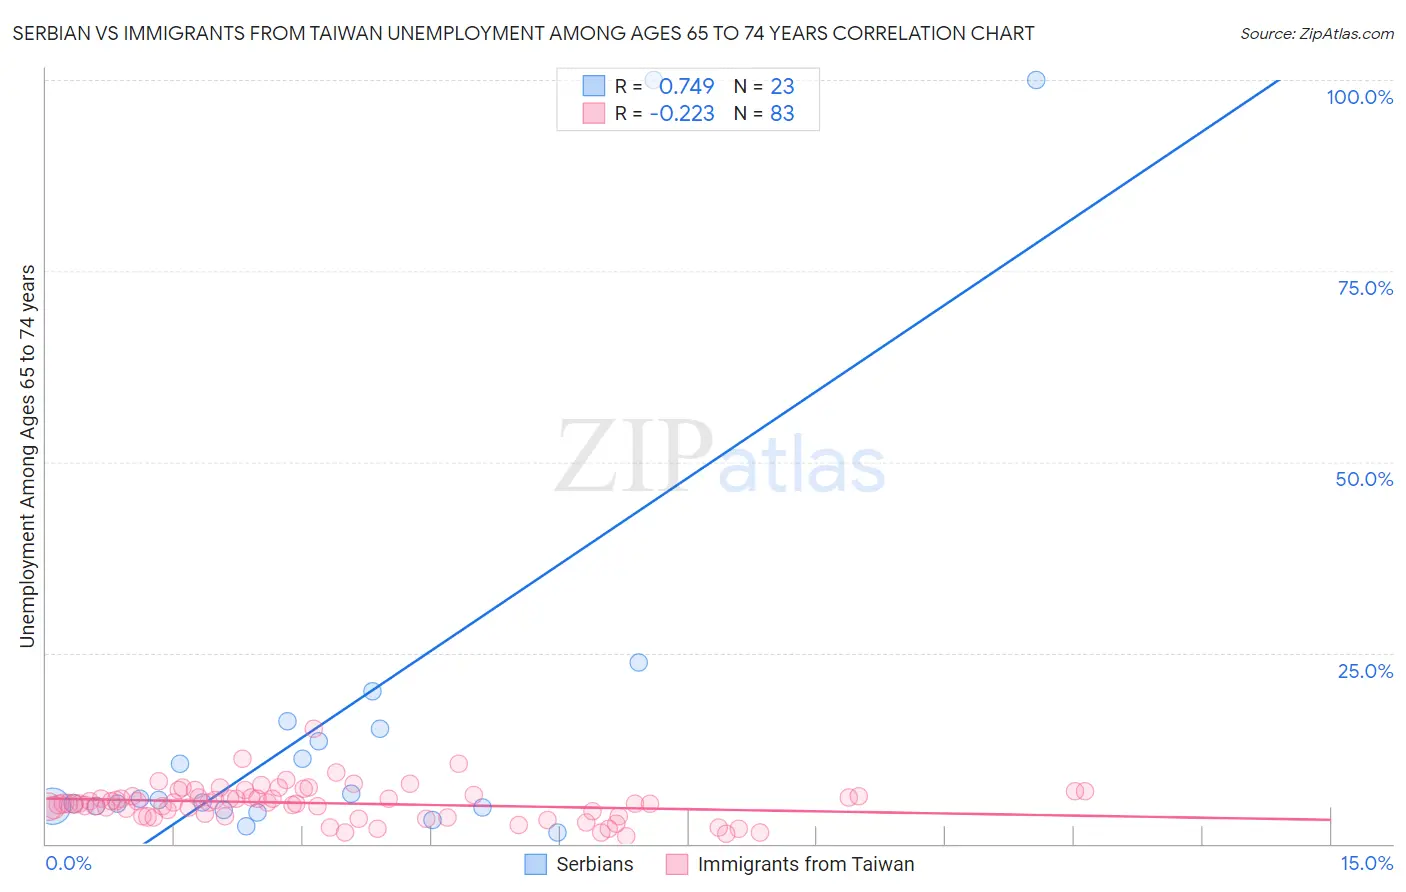
Serbian vs Immigrants from Taiwan Unemployment Among Ages 65 to 74 years Correlation Chart
The statistical analysis conducted on geographies consisting of 243,340,677 people shows a strong positive correlation between the proportion of Serbians and unemployment rate among population between the ages 65 and 74 in the United States with a correlation coefficient (R) of 0.749 and weighted average of 5.2%. Similarly, the statistical analysis conducted on geographies consisting of 273,940,566 people shows a weak negative correlation between the proportion of Immigrants from Taiwan and unemployment rate among population between the ages 65 and 74 in the United States with a correlation coefficient (R) of -0.223 and weighted average of 5.1%, a difference of 1.4%.
Unemployment Among Ages 65 to 74 years Correlation Summary
| Measurement | Serbian | Immigrants from Taiwan |
| Minimum | 1.4% | 1.0% |
| Maximum | 100.0% | 15.1% |
| Range | 98.6% | 14.1% |
| Mean | 16.3% | 5.3% |
| Median | 5.7% | 5.3% |
| Interquartile 25% (IQ1) | 4.8% | 3.6% |
| Interquartile 75% (IQ3) | 15.0% | 6.3% |
| Interquartile Range (IQR) | 10.2% | 2.7% |
| Standard Deviation (Sample) | 27.1% | 2.3% |
| Standard Deviation (Population) | 26.5% | 2.3% |
Similar Demographics by Unemployment Among Ages 65 to 74 years
Demographics Similar to Serbians by Unemployment Among Ages 65 to 74 years
In terms of unemployment among ages 65 to 74 years, the demographic groups most similar to Serbians are South African (5.2%, a difference of 0.0%), Immigrants from Netherlands (5.2%, a difference of 0.020%), Immigrants from Thailand (5.2%, a difference of 0.020%), Puget Sound Salish (5.2%, a difference of 0.080%), and Romanian (5.2%, a difference of 0.11%).
| Demographics | Rating | Rank | Unemployment Among Ages 65 to 74 years |
| Immigrants | Saudi Arabia | 97.9 /100 | #88 | Exceptional 5.2% |
| English | 97.8 /100 | #89 | Exceptional 5.2% |
| Luxembourgers | 97.6 /100 | #90 | Exceptional 5.2% |
| Romanians | 97.4 /100 | #91 | Exceptional 5.2% |
| Puget Sound Salish | 97.3 /100 | #92 | Exceptional 5.2% |
| Immigrants | Netherlands | 97.1 /100 | #93 | Exceptional 5.2% |
| South Africans | 97.1 /100 | #94 | Exceptional 5.2% |
| Serbians | 97.0 /100 | #95 | Exceptional 5.2% |
| Immigrants | Thailand | 97.0 /100 | #96 | Exceptional 5.2% |
| Senegalese | 96.5 /100 | #97 | Exceptional 5.2% |
| Welsh | 96.5 /100 | #98 | Exceptional 5.2% |
| Burmese | 96.4 /100 | #99 | Exceptional 5.2% |
| Japanese | 96.4 /100 | #100 | Exceptional 5.2% |
| Immigrants | Cambodia | 96.3 /100 | #101 | Exceptional 5.2% |
| Immigrants | Lithuania | 95.9 /100 | #102 | Exceptional 5.2% |
Demographics Similar to Immigrants from Taiwan by Unemployment Among Ages 65 to 74 years
In terms of unemployment among ages 65 to 74 years, the demographic groups most similar to Immigrants from Taiwan are Nicaraguan (5.1%, a difference of 0.010%), Kiowa (5.1%, a difference of 0.050%), Immigrants from Jordan (5.1%, a difference of 0.070%), Immigrants from Moldova (5.1%, a difference of 0.10%), and Bolivian (5.1%, a difference of 0.11%).
| Demographics | Rating | Rank | Unemployment Among Ages 65 to 74 years |
| Immigrants | Nicaragua | 99.6 /100 | #54 | Exceptional 5.1% |
| Carpatho Rusyns | 99.6 /100 | #55 | Exceptional 5.1% |
| Swedes | 99.5 /100 | #56 | Exceptional 5.1% |
| Croatians | 99.5 /100 | #57 | Exceptional 5.1% |
| Germans | 99.5 /100 | #58 | Exceptional 5.1% |
| Immigrants | Bulgaria | 99.4 /100 | #59 | Exceptional 5.1% |
| Immigrants | Jordan | 99.4 /100 | #60 | Exceptional 5.1% |
| Immigrants | Taiwan | 99.4 /100 | #61 | Exceptional 5.1% |
| Nicaraguans | 99.4 /100 | #62 | Exceptional 5.1% |
| Kiowa | 99.3 /100 | #63 | Exceptional 5.1% |
| Immigrants | Moldova | 99.3 /100 | #64 | Exceptional 5.1% |
| Bolivians | 99.3 /100 | #65 | Exceptional 5.1% |
| Iroquois | 99.3 /100 | #66 | Exceptional 5.1% |
| Swiss | 99.2 /100 | #67 | Exceptional 5.1% |
| Latvians | 99.2 /100 | #68 | Exceptional 5.1% |