Serbian vs Immigrants from Cabo Verde GED/Equivalency
COMPARE
Serbian
Immigrants from Cabo Verde
GED/Equivalency
GED/Equivalency Comparison
Serbians
Immigrants from Cabo Verde
87.9%
GED/EQUIVALENCY
99.3/ 100
METRIC RATING
59th/ 347
METRIC RANK
78.9%
GED/EQUIVALENCY
0.0/ 100
METRIC RATING
330th/ 347
METRIC RANK
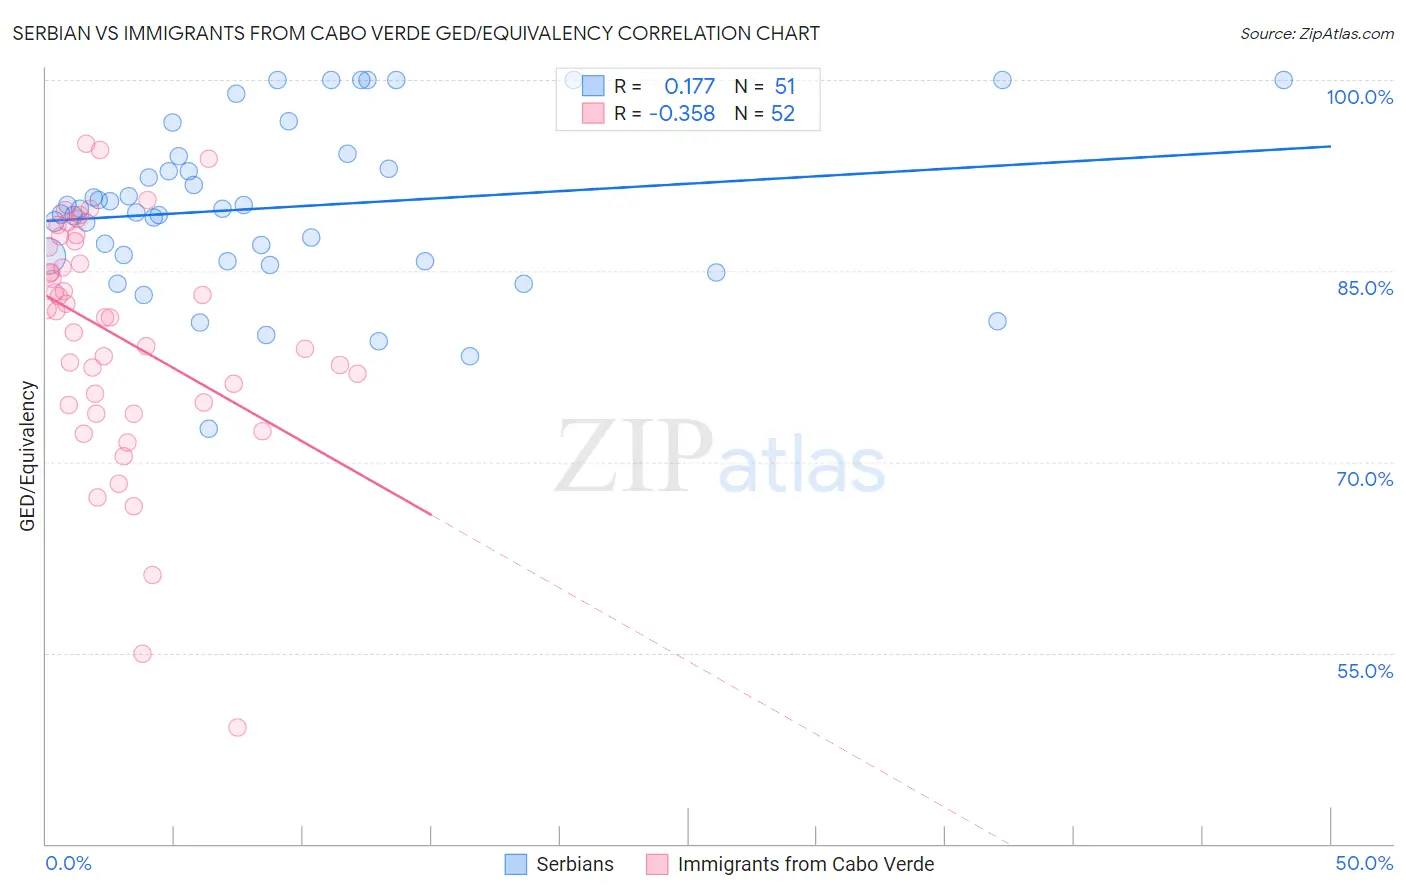
Serbian vs Immigrants from Cabo Verde GED/Equivalency Correlation Chart
The statistical analysis conducted on geographies consisting of 267,642,942 people shows a poor positive correlation between the proportion of Serbians and percentage of population with at least ged/equivalency education in the United States with a correlation coefficient (R) of 0.177 and weighted average of 87.9%. Similarly, the statistical analysis conducted on geographies consisting of 38,158,504 people shows a mild negative correlation between the proportion of Immigrants from Cabo Verde and percentage of population with at least ged/equivalency education in the United States with a correlation coefficient (R) of -0.358 and weighted average of 78.9%, a difference of 11.4%.
GED/Equivalency Correlation Summary
| Measurement | Serbian | Immigrants from Cabo Verde |
| Minimum | 72.6% | 49.2% |
| Maximum | 100.0% | 95.0% |
| Range | 27.4% | 45.8% |
| Mean | 90.0% | 79.9% |
| Median | 89.9% | 81.6% |
| Interquartile 25% (IQ1) | 85.8% | 74.6% |
| Interquartile 75% (IQ3) | 94.0% | 87.1% |
| Interquartile Range (IQR) | 8.2% | 12.6% |
| Standard Deviation (Sample) | 6.5% | 9.5% |
| Standard Deviation (Population) | 6.4% | 9.4% |
Similar Demographics by GED/Equivalency
Demographics Similar to Serbians by GED/Equivalency
In terms of ged/equivalency, the demographic groups most similar to Serbians are Immigrants from Czechoslovakia (87.9%, a difference of 0.010%), Northern European (87.9%, a difference of 0.010%), Scandinavian (87.9%, a difference of 0.010%), European (87.9%, a difference of 0.010%), and German (87.9%, a difference of 0.030%).
| Demographics | Rating | Rank | GED/Equivalency |
| Zimbabweans | 99.4 /100 | #52 | Exceptional 88.0% |
| Immigrants | South Africa | 99.4 /100 | #53 | Exceptional 88.0% |
| Soviet Union | 99.4 /100 | #54 | Exceptional 88.0% |
| New Zealanders | 99.4 /100 | #55 | Exceptional 88.0% |
| Immigrants | Denmark | 99.4 /100 | #56 | Exceptional 88.0% |
| Immigrants | Czechoslovakia | 99.3 /100 | #57 | Exceptional 87.9% |
| Northern Europeans | 99.3 /100 | #58 | Exceptional 87.9% |
| Serbians | 99.3 /100 | #59 | Exceptional 87.9% |
| Scandinavians | 99.3 /100 | #60 | Exceptional 87.9% |
| Europeans | 99.3 /100 | #61 | Exceptional 87.9% |
| Germans | 99.3 /100 | #62 | Exceptional 87.9% |
| Immigrants | Turkey | 99.2 /100 | #63 | Exceptional 87.9% |
| Immigrants | Canada | 99.2 /100 | #64 | Exceptional 87.9% |
| Immigrants | North America | 99.1 /100 | #65 | Exceptional 87.8% |
| Immigrants | Bulgaria | 99.1 /100 | #66 | Exceptional 87.8% |
Demographics Similar to Immigrants from Cabo Verde by GED/Equivalency
In terms of ged/equivalency, the demographic groups most similar to Immigrants from Cabo Verde are Dominican (79.1%, a difference of 0.16%), Hispanic or Latino (79.1%, a difference of 0.20%), Immigrants from Honduras (78.7%, a difference of 0.24%), Central American (79.2%, a difference of 0.31%), and Yuman (79.2%, a difference of 0.33%).
| Demographics | Rating | Rank | GED/Equivalency |
| Immigrants | Nicaragua | 0.0 /100 | #323 | Tragic 79.9% |
| Mexican American Indians | 0.0 /100 | #324 | Tragic 79.4% |
| Hondurans | 0.0 /100 | #325 | Tragic 79.3% |
| Yuman | 0.0 /100 | #326 | Tragic 79.2% |
| Central Americans | 0.0 /100 | #327 | Tragic 79.2% |
| Hispanics or Latinos | 0.0 /100 | #328 | Tragic 79.1% |
| Dominicans | 0.0 /100 | #329 | Tragic 79.1% |
| Immigrants | Cabo Verde | 0.0 /100 | #330 | Tragic 78.9% |
| Immigrants | Honduras | 0.0 /100 | #331 | Tragic 78.7% |
| Immigrants | Azores | 0.0 /100 | #332 | Tragic 78.7% |
| Salvadorans | 0.0 /100 | #333 | Tragic 78.6% |
| Guatemalans | 0.0 /100 | #334 | Tragic 78.5% |
| Immigrants | Latin America | 0.0 /100 | #335 | Tragic 78.5% |
| Immigrants | Dominican Republic | 0.0 /100 | #336 | Tragic 78.0% |
| Immigrants | Yemen | 0.0 /100 | #337 | Tragic 77.9% |