Osage vs Immigrants from Sierra Leone Master's Degree
COMPARE
Osage
Immigrants from Sierra Leone
Master's Degree
Master's Degree Comparison
Osage
Immigrants from Sierra Leone
12.6%
MASTER'S DEGREE
0.7/ 100
METRIC RATING
257th/ 347
METRIC RANK
16.3%
MASTER'S DEGREE
94.7/ 100
METRIC RATING
128th/ 347
METRIC RANK
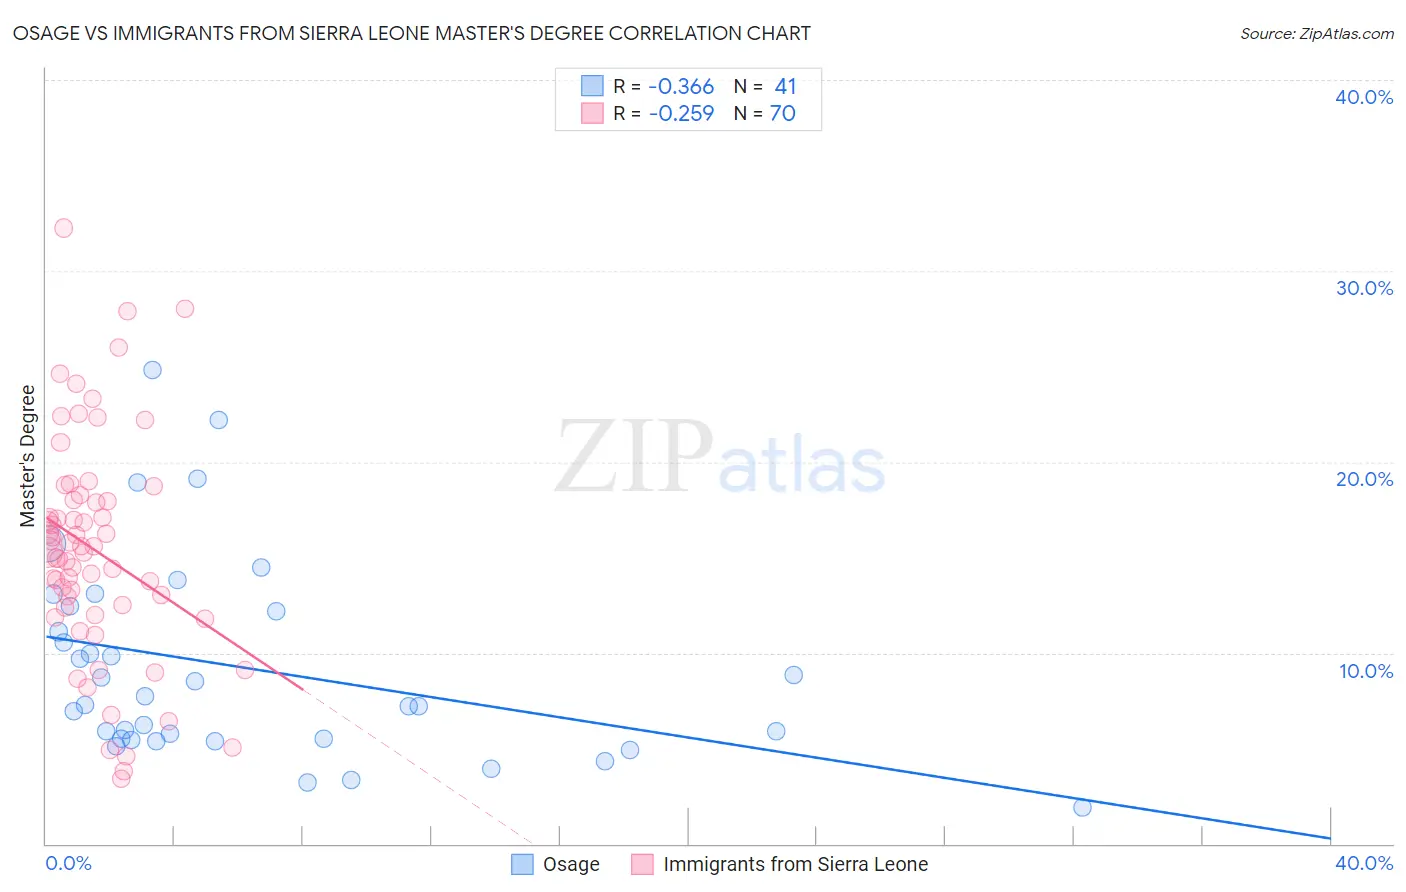
Osage vs Immigrants from Sierra Leone Master's Degree Correlation Chart
The statistical analysis conducted on geographies consisting of 91,790,824 people shows a mild negative correlation between the proportion of Osage and percentage of population with at least master's degree education in the United States with a correlation coefficient (R) of -0.366 and weighted average of 12.6%. Similarly, the statistical analysis conducted on geographies consisting of 101,623,305 people shows a weak negative correlation between the proportion of Immigrants from Sierra Leone and percentage of population with at least master's degree education in the United States with a correlation coefficient (R) of -0.259 and weighted average of 16.3%, a difference of 29.7%.
Master's Degree Correlation Summary
| Measurement | Osage | Immigrants from Sierra Leone |
| Minimum | 1.9% | 3.4% |
| Maximum | 24.8% | 32.2% |
| Range | 22.9% | 28.9% |
| Mean | 9.2% | 15.4% |
| Median | 7.2% | 15.4% |
| Interquartile 25% (IQ1) | 5.5% | 12.4% |
| Interquartile 75% (IQ3) | 12.3% | 18.0% |
| Interquartile Range (IQR) | 6.9% | 5.6% |
| Standard Deviation (Sample) | 5.3% | 5.9% |
| Standard Deviation (Population) | 5.2% | 5.8% |
Similar Demographics by Master's Degree
Demographics Similar to Osage by Master's Degree
In terms of master's degree, the demographic groups most similar to Osage are Immigrants from Portugal (12.6%, a difference of 0.48%), Immigrants from Liberia (12.5%, a difference of 0.50%), Immigrants from Congo (12.6%, a difference of 0.55%), Indonesian (12.6%, a difference of 0.58%), and Japanese (12.5%, a difference of 0.59%).
| Demographics | Rating | Rank | Master's Degree |
| Liberians | 1.3 /100 | #250 | Tragic 12.8% |
| Tlingit-Haida | 1.3 /100 | #251 | Tragic 12.8% |
| French American Indians | 1.0 /100 | #252 | Tragic 12.7% |
| Immigrants | Dominica | 0.8 /100 | #253 | Tragic 12.6% |
| Indonesians | 0.8 /100 | #254 | Tragic 12.6% |
| Immigrants | Congo | 0.8 /100 | #255 | Tragic 12.6% |
| Immigrants | Portugal | 0.8 /100 | #256 | Tragic 12.6% |
| Osage | 0.7 /100 | #257 | Tragic 12.6% |
| Immigrants | Liberia | 0.6 /100 | #258 | Tragic 12.5% |
| Japanese | 0.6 /100 | #259 | Tragic 12.5% |
| Dominicans | 0.6 /100 | #260 | Tragic 12.5% |
| Tongans | 0.6 /100 | #261 | Tragic 12.5% |
| Nicaraguans | 0.6 /100 | #262 | Tragic 12.5% |
| Central American Indians | 0.5 /100 | #263 | Tragic 12.4% |
| Belizeans | 0.5 /100 | #264 | Tragic 12.4% |
Demographics Similar to Immigrants from Sierra Leone by Master's Degree
In terms of master's degree, the demographic groups most similar to Immigrants from Sierra Leone are Palestinian (16.3%, a difference of 0.050%), Immigrants from Eastern Africa (16.3%, a difference of 0.31%), Italian (16.4%, a difference of 0.42%), Immigrants from Eritrea (16.4%, a difference of 0.50%), and Croatian (16.4%, a difference of 0.57%).
| Demographics | Rating | Rank | Master's Degree |
| Afghans | 96.2 /100 | #121 | Exceptional 16.5% |
| British | 95.6 /100 | #122 | Exceptional 16.4% |
| Croatians | 95.6 /100 | #123 | Exceptional 16.4% |
| Immigrants | Eritrea | 95.5 /100 | #124 | Exceptional 16.4% |
| Italians | 95.4 /100 | #125 | Exceptional 16.4% |
| Immigrants | Eastern Africa | 95.2 /100 | #126 | Exceptional 16.3% |
| Palestinians | 94.8 /100 | #127 | Exceptional 16.3% |
| Immigrants | Sierra Leone | 94.7 /100 | #128 | Exceptional 16.3% |
| Immigrants | Syria | 93.3 /100 | #129 | Exceptional 16.2% |
| Immigrants | Jordan | 92.7 /100 | #130 | Exceptional 16.1% |
| Taiwanese | 91.9 /100 | #131 | Exceptional 16.1% |
| Serbians | 91.7 /100 | #132 | Exceptional 16.1% |
| Immigrants | Sudan | 90.2 /100 | #133 | Exceptional 16.0% |
| Venezuelans | 88.4 /100 | #134 | Excellent 15.9% |
| South American Indians | 88.4 /100 | #135 | Excellent 15.9% |