Navajo vs Immigrants from Sierra Leone Master's Degree
COMPARE
Navajo
Immigrants from Sierra Leone
Master's Degree
Master's Degree Comparison
Navajo
Immigrants from Sierra Leone
9.4%
MASTER'S DEGREE
0.0/ 100
METRIC RATING
341st/ 347
METRIC RANK
16.3%
MASTER'S DEGREE
94.7/ 100
METRIC RATING
128th/ 347
METRIC RANK
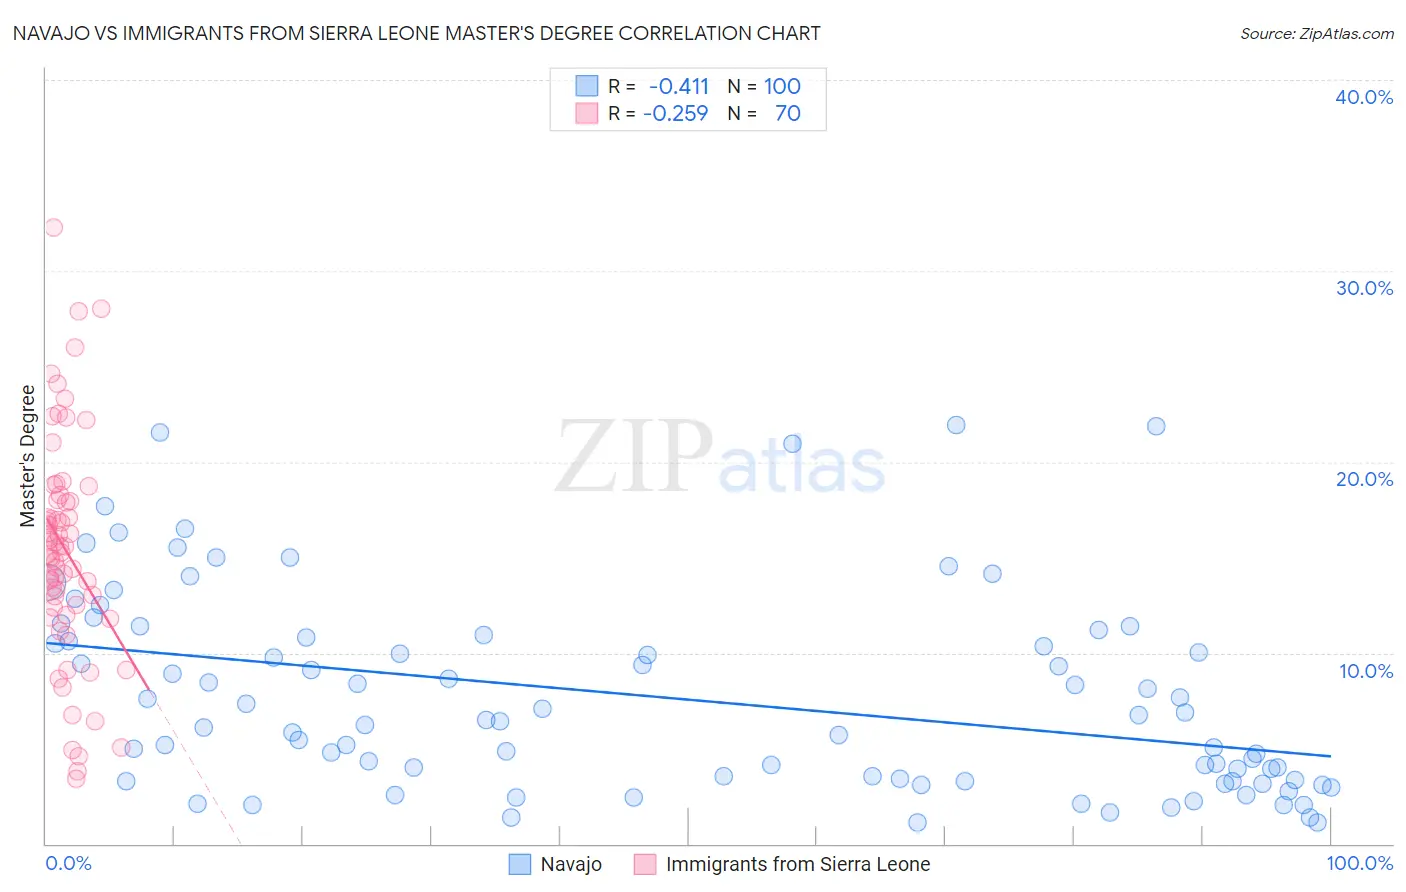
Navajo vs Immigrants from Sierra Leone Master's Degree Correlation Chart
The statistical analysis conducted on geographies consisting of 224,762,496 people shows a moderate negative correlation between the proportion of Navajo and percentage of population with at least master's degree education in the United States with a correlation coefficient (R) of -0.411 and weighted average of 9.4%. Similarly, the statistical analysis conducted on geographies consisting of 101,623,305 people shows a weak negative correlation between the proportion of Immigrants from Sierra Leone and percentage of population with at least master's degree education in the United States with a correlation coefficient (R) of -0.259 and weighted average of 16.3%, a difference of 72.8%.
Master's Degree Correlation Summary
| Measurement | Navajo | Immigrants from Sierra Leone |
| Minimum | 1.1% | 3.4% |
| Maximum | 22.0% | 32.2% |
| Range | 20.9% | 28.9% |
| Mean | 7.6% | 15.4% |
| Median | 6.3% | 15.4% |
| Interquartile 25% (IQ1) | 3.3% | 12.4% |
| Interquartile 75% (IQ3) | 10.7% | 18.0% |
| Interquartile Range (IQR) | 7.4% | 5.6% |
| Standard Deviation (Sample) | 5.2% | 5.9% |
| Standard Deviation (Population) | 5.1% | 5.8% |
Similar Demographics by Master's Degree
Demographics Similar to Navajo by Master's Degree
In terms of master's degree, the demographic groups most similar to Navajo are Yakama (9.5%, a difference of 0.35%), Immigrants from Mexico (9.3%, a difference of 1.3%), Spanish American Indian (9.6%, a difference of 1.6%), Lumbee (9.3%, a difference of 1.8%), and Pima (9.2%, a difference of 1.9%).
| Demographics | Rating | Rank | Master's Degree |
| Menominee | 0.0 /100 | #333 | Tragic 10.2% |
| Arapaho | 0.0 /100 | #334 | Tragic 10.0% |
| Immigrants | Central America | 0.0 /100 | #335 | Tragic 10.0% |
| Natives/Alaskans | 0.0 /100 | #336 | Tragic 9.9% |
| Mexicans | 0.0 /100 | #337 | Tragic 9.7% |
| Tohono O'odham | 0.0 /100 | #338 | Tragic 9.7% |
| Spanish American Indians | 0.0 /100 | #339 | Tragic 9.6% |
| Yakama | 0.0 /100 | #340 | Tragic 9.5% |
| Navajo | 0.0 /100 | #341 | Tragic 9.4% |
| Immigrants | Mexico | 0.0 /100 | #342 | Tragic 9.3% |
| Lumbee | 0.0 /100 | #343 | Tragic 9.3% |
| Pima | 0.0 /100 | #344 | Tragic 9.2% |
| Yuman | 0.0 /100 | #345 | Tragic 9.2% |
| Yup'ik | 0.0 /100 | #346 | Tragic 8.5% |
| Houma | 0.0 /100 | #347 | Tragic 7.9% |
Demographics Similar to Immigrants from Sierra Leone by Master's Degree
In terms of master's degree, the demographic groups most similar to Immigrants from Sierra Leone are Palestinian (16.3%, a difference of 0.050%), Immigrants from Eastern Africa (16.3%, a difference of 0.31%), Italian (16.4%, a difference of 0.42%), Immigrants from Eritrea (16.4%, a difference of 0.50%), and Croatian (16.4%, a difference of 0.57%).
| Demographics | Rating | Rank | Master's Degree |
| Afghans | 96.2 /100 | #121 | Exceptional 16.5% |
| British | 95.6 /100 | #122 | Exceptional 16.4% |
| Croatians | 95.6 /100 | #123 | Exceptional 16.4% |
| Immigrants | Eritrea | 95.5 /100 | #124 | Exceptional 16.4% |
| Italians | 95.4 /100 | #125 | Exceptional 16.4% |
| Immigrants | Eastern Africa | 95.2 /100 | #126 | Exceptional 16.3% |
| Palestinians | 94.8 /100 | #127 | Exceptional 16.3% |
| Immigrants | Sierra Leone | 94.7 /100 | #128 | Exceptional 16.3% |
| Immigrants | Syria | 93.3 /100 | #129 | Exceptional 16.2% |
| Immigrants | Jordan | 92.7 /100 | #130 | Exceptional 16.1% |
| Taiwanese | 91.9 /100 | #131 | Exceptional 16.1% |
| Serbians | 91.7 /100 | #132 | Exceptional 16.1% |
| Immigrants | Sudan | 90.2 /100 | #133 | Exceptional 16.0% |
| Venezuelans | 88.4 /100 | #134 | Excellent 15.9% |
| South American Indians | 88.4 /100 | #135 | Excellent 15.9% |