Immigrants from Yemen vs Immigrants from Sierra Leone Master's Degree
COMPARE
Immigrants from Yemen
Immigrants from Sierra Leone
Master's Degree
Master's Degree Comparison
Immigrants from Yemen
Immigrants from Sierra Leone
11.6%
MASTER'S DEGREE
0.1/ 100
METRIC RATING
297th/ 347
METRIC RANK
16.3%
MASTER'S DEGREE
94.7/ 100
METRIC RATING
128th/ 347
METRIC RANK
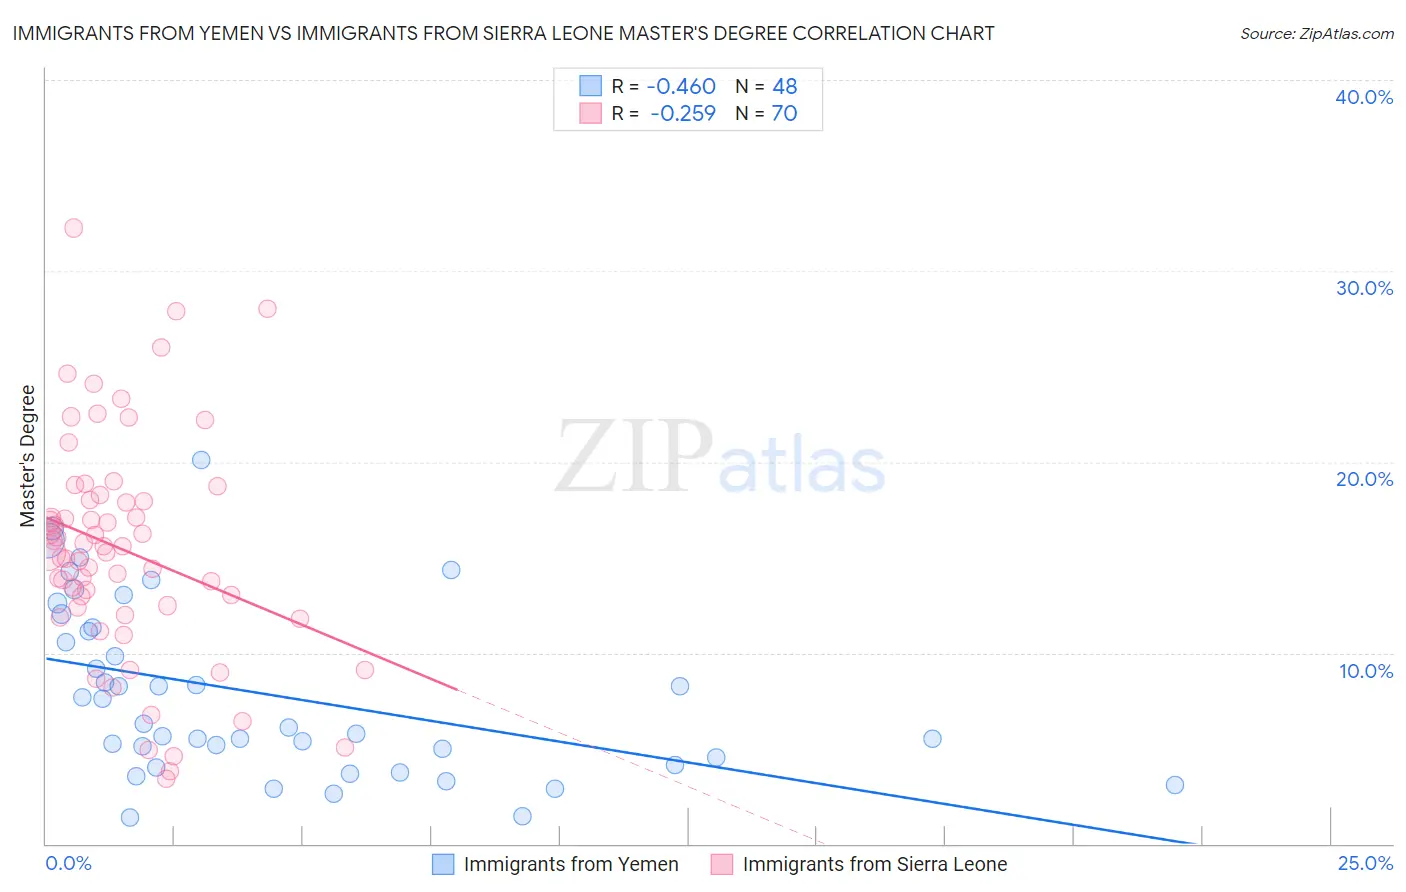
Immigrants from Yemen vs Immigrants from Sierra Leone Master's Degree Correlation Chart
The statistical analysis conducted on geographies consisting of 82,412,515 people shows a moderate negative correlation between the proportion of Immigrants from Yemen and percentage of population with at least master's degree education in the United States with a correlation coefficient (R) of -0.460 and weighted average of 11.6%. Similarly, the statistical analysis conducted on geographies consisting of 101,623,305 people shows a weak negative correlation between the proportion of Immigrants from Sierra Leone and percentage of population with at least master's degree education in the United States with a correlation coefficient (R) of -0.259 and weighted average of 16.3%, a difference of 41.0%.
Master's Degree Correlation Summary
| Measurement | Immigrants from Yemen | Immigrants from Sierra Leone |
| Minimum | 1.3% | 3.4% |
| Maximum | 20.1% | 32.2% |
| Range | 18.7% | 28.9% |
| Mean | 7.8% | 15.4% |
| Median | 6.2% | 15.4% |
| Interquartile 25% (IQ1) | 4.3% | 12.4% |
| Interquartile 75% (IQ3) | 11.2% | 18.0% |
| Interquartile Range (IQR) | 6.9% | 5.6% |
| Standard Deviation (Sample) | 4.5% | 5.9% |
| Standard Deviation (Population) | 4.5% | 5.8% |
Similar Demographics by Master's Degree
Demographics Similar to Immigrants from Yemen by Master's Degree
In terms of master's degree, the demographic groups most similar to Immigrants from Yemen are Alaskan Athabascan (11.6%, a difference of 0.12%), Marshallese (11.6%, a difference of 0.13%), Hawaiian (11.6%, a difference of 0.28%), Alaska Native (11.6%, a difference of 0.38%), and Immigrants from Guatemala (11.6%, a difference of 0.61%).
| Demographics | Rating | Rank | Master's Degree |
| Ute | 0.1 /100 | #290 | Tragic 11.7% |
| Colville | 0.1 /100 | #291 | Tragic 11.6% |
| Immigrants | Guatemala | 0.1 /100 | #292 | Tragic 11.6% |
| Alaska Natives | 0.1 /100 | #293 | Tragic 11.6% |
| Hawaiians | 0.1 /100 | #294 | Tragic 11.6% |
| Marshallese | 0.1 /100 | #295 | Tragic 11.6% |
| Alaskan Athabascans | 0.1 /100 | #296 | Tragic 11.6% |
| Immigrants | Yemen | 0.1 /100 | #297 | Tragic 11.6% |
| Samoans | 0.1 /100 | #298 | Tragic 11.5% |
| Chickasaw | 0.1 /100 | #299 | Tragic 11.4% |
| Chippewa | 0.1 /100 | #300 | Tragic 11.4% |
| Tsimshian | 0.1 /100 | #301 | Tragic 11.4% |
| Cherokee | 0.1 /100 | #302 | Tragic 11.4% |
| Immigrants | Laos | 0.1 /100 | #303 | Tragic 11.4% |
| Immigrants | Cabo Verde | 0.1 /100 | #304 | Tragic 11.3% |
Demographics Similar to Immigrants from Sierra Leone by Master's Degree
In terms of master's degree, the demographic groups most similar to Immigrants from Sierra Leone are Palestinian (16.3%, a difference of 0.050%), Immigrants from Eastern Africa (16.3%, a difference of 0.31%), Italian (16.4%, a difference of 0.42%), Immigrants from Eritrea (16.4%, a difference of 0.50%), and Croatian (16.4%, a difference of 0.57%).
| Demographics | Rating | Rank | Master's Degree |
| Afghans | 96.2 /100 | #121 | Exceptional 16.5% |
| British | 95.6 /100 | #122 | Exceptional 16.4% |
| Croatians | 95.6 /100 | #123 | Exceptional 16.4% |
| Immigrants | Eritrea | 95.5 /100 | #124 | Exceptional 16.4% |
| Italians | 95.4 /100 | #125 | Exceptional 16.4% |
| Immigrants | Eastern Africa | 95.2 /100 | #126 | Exceptional 16.3% |
| Palestinians | 94.8 /100 | #127 | Exceptional 16.3% |
| Immigrants | Sierra Leone | 94.7 /100 | #128 | Exceptional 16.3% |
| Immigrants | Syria | 93.3 /100 | #129 | Exceptional 16.2% |
| Immigrants | Jordan | 92.7 /100 | #130 | Exceptional 16.1% |
| Taiwanese | 91.9 /100 | #131 | Exceptional 16.1% |
| Serbians | 91.7 /100 | #132 | Exceptional 16.1% |
| Immigrants | Sudan | 90.2 /100 | #133 | Exceptional 16.0% |
| Venezuelans | 88.4 /100 | #134 | Excellent 15.9% |
| South American Indians | 88.4 /100 | #135 | Excellent 15.9% |