Ute vs Immigrants from Hong Kong Master's Degree
COMPARE
Ute
Immigrants from Hong Kong
Master's Degree
Master's Degree Comparison
Ute
Immigrants from Hong Kong
11.7%
MASTER'S DEGREE
0.1/ 100
METRIC RATING
290th/ 347
METRIC RANK
20.5%
MASTER'S DEGREE
100.0/ 100
METRIC RATING
19th/ 347
METRIC RANK
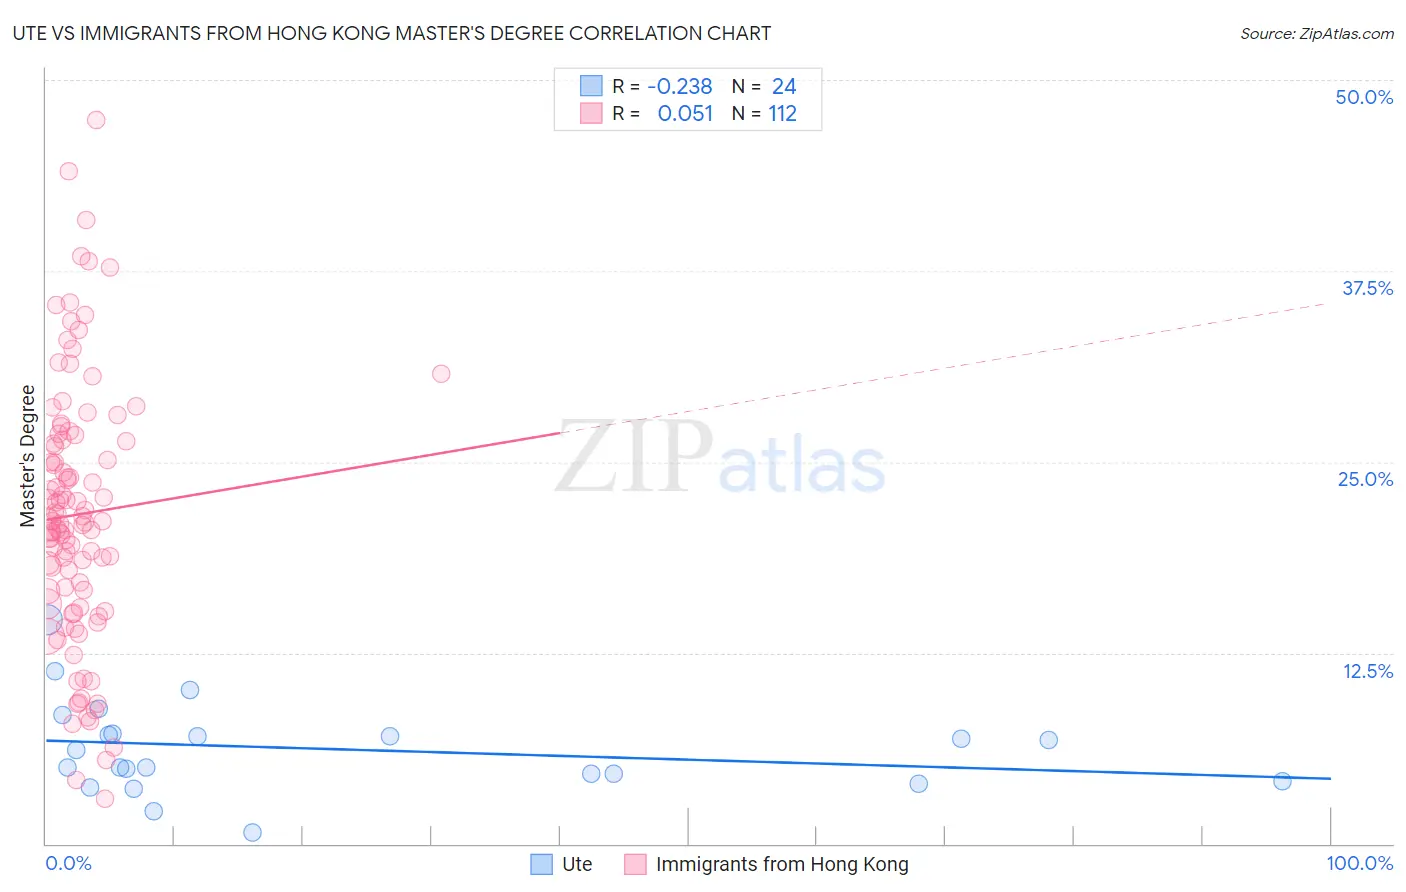
Ute vs Immigrants from Hong Kong Master's Degree Correlation Chart
The statistical analysis conducted on geographies consisting of 55,657,479 people shows a weak negative correlation between the proportion of Ute and percentage of population with at least master's degree education in the United States with a correlation coefficient (R) of -0.238 and weighted average of 11.7%. Similarly, the statistical analysis conducted on geographies consisting of 253,947,811 people shows a slight positive correlation between the proportion of Immigrants from Hong Kong and percentage of population with at least master's degree education in the United States with a correlation coefficient (R) of 0.051 and weighted average of 20.5%, a difference of 74.5%.
Master's Degree Correlation Summary
| Measurement | Ute | Immigrants from Hong Kong |
| Minimum | 0.74% | 2.9% |
| Maximum | 14.6% | 47.4% |
| Range | 13.9% | 44.5% |
| Mean | 6.2% | 21.6% |
| Median | 5.6% | 21.1% |
| Interquartile 25% (IQ1) | 4.4% | 16.1% |
| Interquartile 75% (IQ3) | 7.2% | 26.4% |
| Interquartile Range (IQR) | 2.8% | 10.3% |
| Standard Deviation (Sample) | 3.0% | 8.5% |
| Standard Deviation (Population) | 2.9% | 8.5% |
Similar Demographics by Master's Degree
Demographics Similar to Ute by Master's Degree
In terms of master's degree, the demographic groups most similar to Ute are Guatemalan (11.7%, a difference of 0.24%), Immigrants from Honduras (11.8%, a difference of 0.32%), Immigrants from Haiti (11.8%, a difference of 0.49%), Colville (11.6%, a difference of 0.67%), and Aleut (11.8%, a difference of 0.69%).
| Demographics | Rating | Rank | Master's Degree |
| Hondurans | 0.2 /100 | #283 | Tragic 11.9% |
| Ottawa | 0.2 /100 | #284 | Tragic 11.9% |
| Immigrants | Nicaragua | 0.2 /100 | #285 | Tragic 11.8% |
| Aleuts | 0.1 /100 | #286 | Tragic 11.8% |
| Immigrants | Haiti | 0.1 /100 | #287 | Tragic 11.8% |
| Immigrants | Honduras | 0.1 /100 | #288 | Tragic 11.8% |
| Guatemalans | 0.1 /100 | #289 | Tragic 11.7% |
| Ute | 0.1 /100 | #290 | Tragic 11.7% |
| Colville | 0.1 /100 | #291 | Tragic 11.6% |
| Immigrants | Guatemala | 0.1 /100 | #292 | Tragic 11.6% |
| Alaska Natives | 0.1 /100 | #293 | Tragic 11.6% |
| Hawaiians | 0.1 /100 | #294 | Tragic 11.6% |
| Marshallese | 0.1 /100 | #295 | Tragic 11.6% |
| Alaskan Athabascans | 0.1 /100 | #296 | Tragic 11.6% |
| Immigrants | Yemen | 0.1 /100 | #297 | Tragic 11.6% |
Demographics Similar to Immigrants from Hong Kong by Master's Degree
In terms of master's degree, the demographic groups most similar to Immigrants from Hong Kong are Indian (Asian) (20.5%, a difference of 0.020%), Immigrants from Ireland (20.4%, a difference of 0.13%), Soviet Union (20.5%, a difference of 0.35%), Israeli (20.3%, a difference of 0.55%), and Immigrants from France (20.3%, a difference of 0.83%).
| Demographics | Rating | Rank | Master's Degree |
| Eastern Europeans | 100.0 /100 | #12 | Exceptional 21.1% |
| Immigrants | Australia | 100.0 /100 | #13 | Exceptional 20.9% |
| Immigrants | Switzerland | 100.0 /100 | #14 | Exceptional 20.9% |
| Immigrants | Eastern Asia | 100.0 /100 | #15 | Exceptional 20.8% |
| Immigrants | Belgium | 100.0 /100 | #16 | Exceptional 20.8% |
| Immigrants | South Central Asia | 100.0 /100 | #17 | Exceptional 20.7% |
| Soviet Union | 100.0 /100 | #18 | Exceptional 20.5% |
| Immigrants | Hong Kong | 100.0 /100 | #19 | Exceptional 20.5% |
| Indians (Asian) | 100.0 /100 | #20 | Exceptional 20.5% |
| Immigrants | Ireland | 100.0 /100 | #21 | Exceptional 20.4% |
| Israelis | 100.0 /100 | #22 | Exceptional 20.3% |
| Immigrants | France | 100.0 /100 | #23 | Exceptional 20.3% |
| Immigrants | Sweden | 100.0 /100 | #24 | Exceptional 20.3% |
| Immigrants | Japan | 100.0 /100 | #25 | Exceptional 20.0% |
| Cambodians | 100.0 /100 | #26 | Exceptional 20.0% |