Scottish vs Immigrants from Cabo Verde Bachelor's Degree
COMPARE
Scottish
Immigrants from Cabo Verde
Bachelor's Degree
Bachelor's Degree Comparison
Scottish
Immigrants from Cabo Verde
38.1%
BACHELOR'S DEGREE
56.6/ 100
METRIC RATING
167th/ 347
METRIC RANK
29.2%
BACHELOR'S DEGREE
0.0/ 100
METRIC RATING
315th/ 347
METRIC RANK
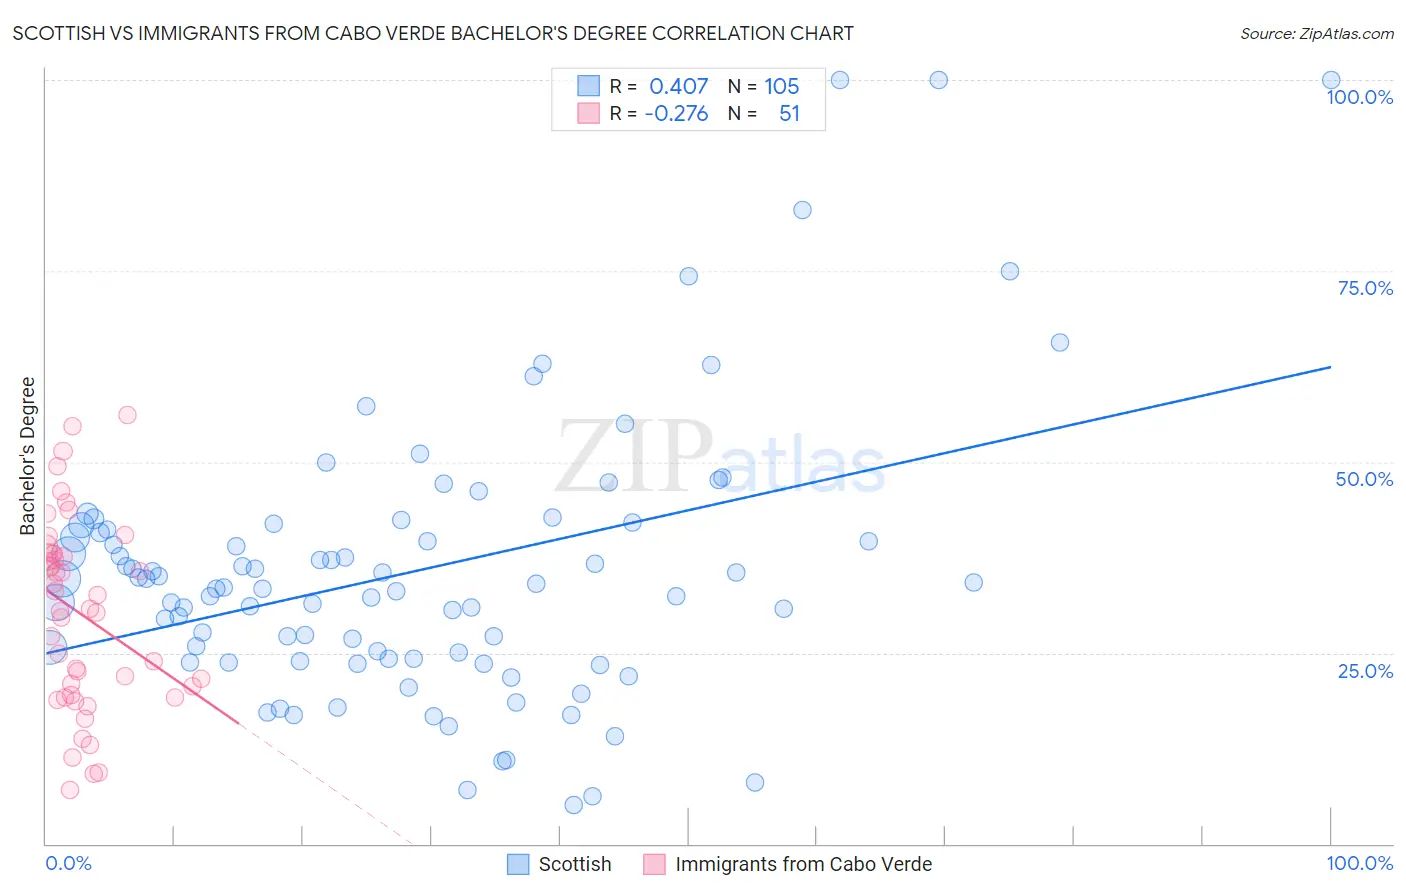
Scottish vs Immigrants from Cabo Verde Bachelor's Degree Correlation Chart
The statistical analysis conducted on geographies consisting of 567,001,084 people shows a moderate positive correlation between the proportion of Scottish and percentage of population with at least bachelor's degree education in the United States with a correlation coefficient (R) of 0.407 and weighted average of 38.1%. Similarly, the statistical analysis conducted on geographies consisting of 38,158,316 people shows a weak negative correlation between the proportion of Immigrants from Cabo Verde and percentage of population with at least bachelor's degree education in the United States with a correlation coefficient (R) of -0.276 and weighted average of 29.2%, a difference of 30.2%.
Bachelor's Degree Correlation Summary
| Measurement | Scottish | Immigrants from Cabo Verde |
| Minimum | 5.1% | 7.1% |
| Maximum | 100.0% | 56.1% |
| Range | 94.9% | 49.0% |
| Mean | 35.6% | 30.1% |
| Median | 33.5% | 30.8% |
| Interquartile 25% (IQ1) | 24.2% | 19.4% |
| Interquartile 75% (IQ3) | 41.4% | 38.0% |
| Interquartile Range (IQR) | 17.2% | 18.6% |
| Standard Deviation (Sample) | 18.1% | 12.3% |
| Standard Deviation (Population) | 18.0% | 12.1% |
Similar Demographics by Bachelor's Degree
Demographics Similar to Scottish by Bachelor's Degree
In terms of bachelor's degree, the demographic groups most similar to Scottish are Danish (38.1%, a difference of 0.030%), Ghanaian (38.0%, a difference of 0.12%), Somali (38.1%, a difference of 0.21%), Czech (38.0%, a difference of 0.22%), and Bermudan (38.0%, a difference of 0.23%).
| Demographics | Rating | Rank | Bachelor's Degree |
| Vietnamese | 66.6 /100 | #160 | Good 38.5% |
| Uruguayans | 65.8 /100 | #161 | Good 38.4% |
| Colombians | 65.0 /100 | #162 | Good 38.4% |
| Peruvians | 63.4 /100 | #163 | Good 38.3% |
| Hungarians | 62.1 /100 | #164 | Good 38.3% |
| Sri Lankans | 59.1 /100 | #165 | Average 38.2% |
| Somalis | 58.6 /100 | #166 | Average 38.1% |
| Scottish | 56.6 /100 | #167 | Average 38.1% |
| Danes | 56.2 /100 | #168 | Average 38.1% |
| Ghanaians | 55.3 /100 | #169 | Average 38.0% |
| Czechs | 54.4 /100 | #170 | Average 38.0% |
| Bermudans | 54.2 /100 | #171 | Average 38.0% |
| Immigrants | Somalia | 52.8 /100 | #172 | Average 37.9% |
| Immigrants | Iraq | 52.5 /100 | #173 | Average 37.9% |
| Immigrants | Bangladesh | 50.0 /100 | #174 | Average 37.8% |
Demographics Similar to Immigrants from Cabo Verde by Bachelor's Degree
In terms of bachelor's degree, the demographic groups most similar to Immigrants from Cabo Verde are Shoshone (29.3%, a difference of 0.080%), Alaska Native (29.4%, a difference of 0.37%), Seminole (29.4%, a difference of 0.56%), Choctaw (29.4%, a difference of 0.61%), and Sioux (29.1%, a difference of 0.62%).
| Demographics | Rating | Rank | Bachelor's Degree |
| Cajuns | 0.0 /100 | #308 | Tragic 29.6% |
| Hispanics or Latinos | 0.0 /100 | #309 | Tragic 29.6% |
| Cheyenne | 0.0 /100 | #310 | Tragic 29.4% |
| Choctaw | 0.0 /100 | #311 | Tragic 29.4% |
| Seminole | 0.0 /100 | #312 | Tragic 29.4% |
| Alaska Natives | 0.0 /100 | #313 | Tragic 29.4% |
| Shoshone | 0.0 /100 | #314 | Tragic 29.3% |
| Immigrants | Cabo Verde | 0.0 /100 | #315 | Tragic 29.2% |
| Sioux | 0.0 /100 | #316 | Tragic 29.1% |
| Colville | 0.0 /100 | #317 | Tragic 29.0% |
| Yaqui | 0.0 /100 | #318 | Tragic 29.0% |
| Creek | 0.0 /100 | #319 | Tragic 28.9% |
| Kiowa | 0.0 /100 | #320 | Tragic 28.8% |
| Alaskan Athabascans | 0.0 /100 | #321 | Tragic 28.8% |
| Tsimshian | 0.0 /100 | #322 | Tragic 28.8% |