Scottish vs Slavic Bachelor's Degree
COMPARE
Scottish
Slavic
Bachelor's Degree
Bachelor's Degree Comparison
Scottish
Slavs
38.1%
BACHELOR'S DEGREE
56.6/ 100
METRIC RATING
167th/ 347
METRIC RANK
38.9%
BACHELOR'S DEGREE
75.9/ 100
METRIC RATING
153rd/ 347
METRIC RANK
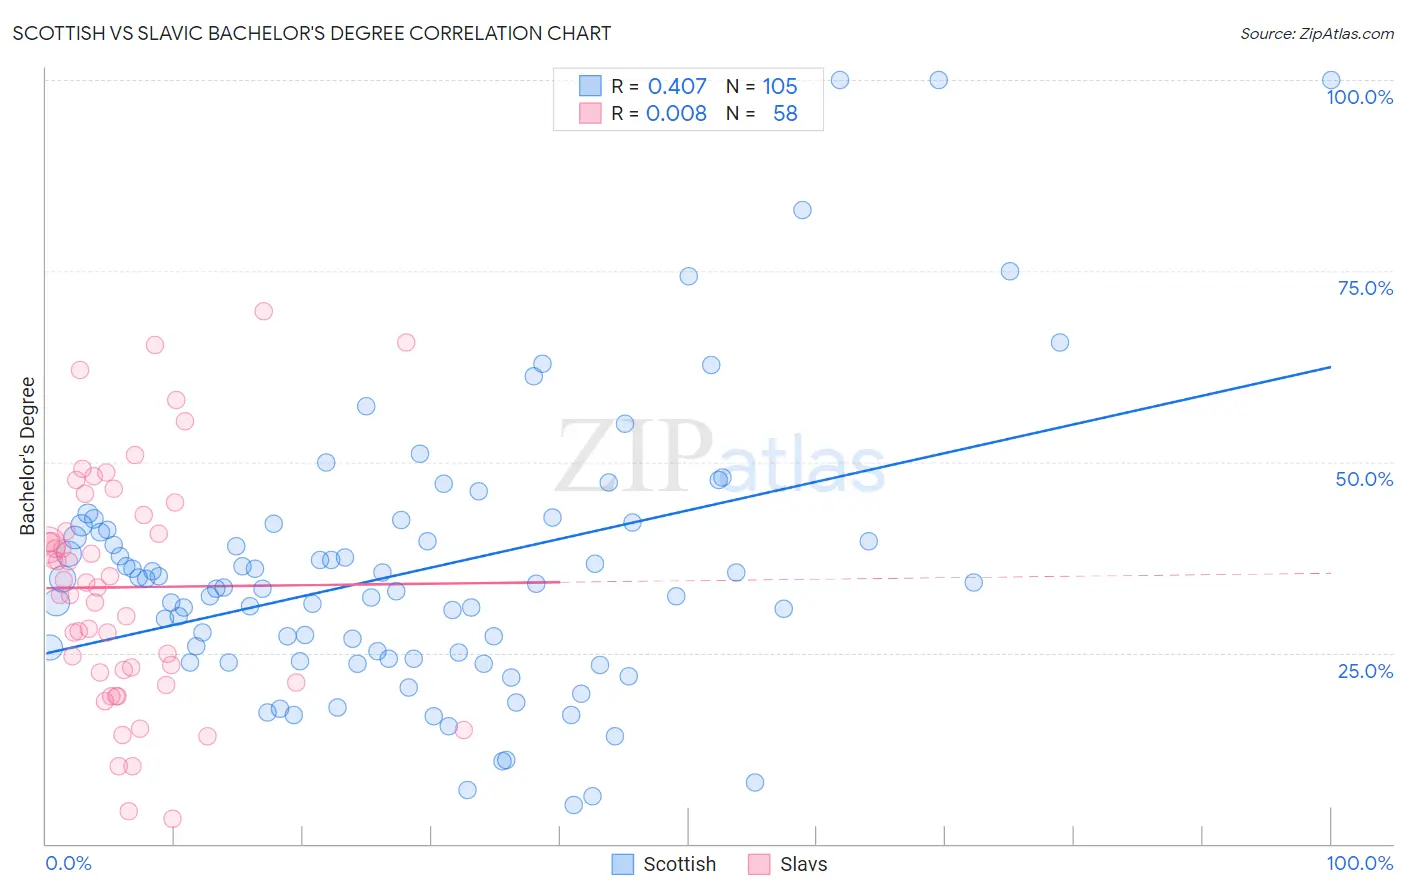
Scottish vs Slavic Bachelor's Degree Correlation Chart
The statistical analysis conducted on geographies consisting of 567,001,084 people shows a moderate positive correlation between the proportion of Scottish and percentage of population with at least bachelor's degree education in the United States with a correlation coefficient (R) of 0.407 and weighted average of 38.1%. Similarly, the statistical analysis conducted on geographies consisting of 270,854,926 people shows no correlation between the proportion of Slavs and percentage of population with at least bachelor's degree education in the United States with a correlation coefficient (R) of 0.008 and weighted average of 38.9%, a difference of 2.1%.
Bachelor's Degree Correlation Summary
| Measurement | Scottish | Slavic |
| Minimum | 5.1% | 3.3% |
| Maximum | 100.0% | 69.8% |
| Range | 94.9% | 66.4% |
| Mean | 35.6% | 33.6% |
| Median | 33.5% | 33.9% |
| Interquartile 25% (IQ1) | 24.2% | 22.4% |
| Interquartile 75% (IQ3) | 41.4% | 43.0% |
| Interquartile Range (IQR) | 17.2% | 20.7% |
| Standard Deviation (Sample) | 18.1% | 15.4% |
| Standard Deviation (Population) | 18.0% | 15.3% |
Demographics Similar to Scottish and Slavs by Bachelor's Degree
In terms of bachelor's degree, the demographic groups most similar to Scottish are Danish (38.1%, a difference of 0.030%), Ghanaian (38.0%, a difference of 0.12%), Somali (38.1%, a difference of 0.21%), Czech (38.0%, a difference of 0.22%), and Sri Lankan (38.2%, a difference of 0.25%). Similarly, the demographic groups most similar to Slavs are Sudanese (38.9%, a difference of 0.060%), Immigrants from Africa (38.9%, a difference of 0.080%), Canadian (38.8%, a difference of 0.12%), South American (38.9%, a difference of 0.18%), and Immigrants from Kenya (38.8%, a difference of 0.27%).
| Demographics | Rating | Rank | Bachelor's Degree |
| South Americans | 77.3 /100 | #150 | Good 38.9% |
| Immigrants | Africa | 76.5 /100 | #151 | Good 38.9% |
| Sudanese | 76.4 /100 | #152 | Good 38.9% |
| Slavs | 75.9 /100 | #153 | Good 38.9% |
| Canadians | 75.0 /100 | #154 | Good 38.8% |
| Immigrants | Kenya | 73.8 /100 | #155 | Good 38.8% |
| Kenyans | 72.5 /100 | #156 | Good 38.7% |
| Immigrants | South America | 70.1 /100 | #157 | Good 38.6% |
| Immigrants | Germany | 69.6 /100 | #158 | Good 38.6% |
| Chinese | 66.6 /100 | #159 | Good 38.5% |
| Vietnamese | 66.6 /100 | #160 | Good 38.5% |
| Uruguayans | 65.8 /100 | #161 | Good 38.4% |
| Colombians | 65.0 /100 | #162 | Good 38.4% |
| Peruvians | 63.4 /100 | #163 | Good 38.3% |
| Hungarians | 62.1 /100 | #164 | Good 38.3% |
| Sri Lankans | 59.1 /100 | #165 | Average 38.2% |
| Somalis | 58.6 /100 | #166 | Average 38.1% |
| Scottish | 56.6 /100 | #167 | Average 38.1% |
| Danes | 56.2 /100 | #168 | Average 38.1% |
| Ghanaians | 55.3 /100 | #169 | Average 38.0% |
| Czechs | 54.4 /100 | #170 | Average 38.0% |