Tongan vs Immigrants from Cabo Verde Bachelor's Degree
COMPARE
Tongan
Immigrants from Cabo Verde
Bachelor's Degree
Bachelor's Degree Comparison
Tongans
Immigrants from Cabo Verde
34.3%
BACHELOR'S DEGREE
2.0/ 100
METRIC RATING
240th/ 347
METRIC RANK
29.2%
BACHELOR'S DEGREE
0.0/ 100
METRIC RATING
315th/ 347
METRIC RANK
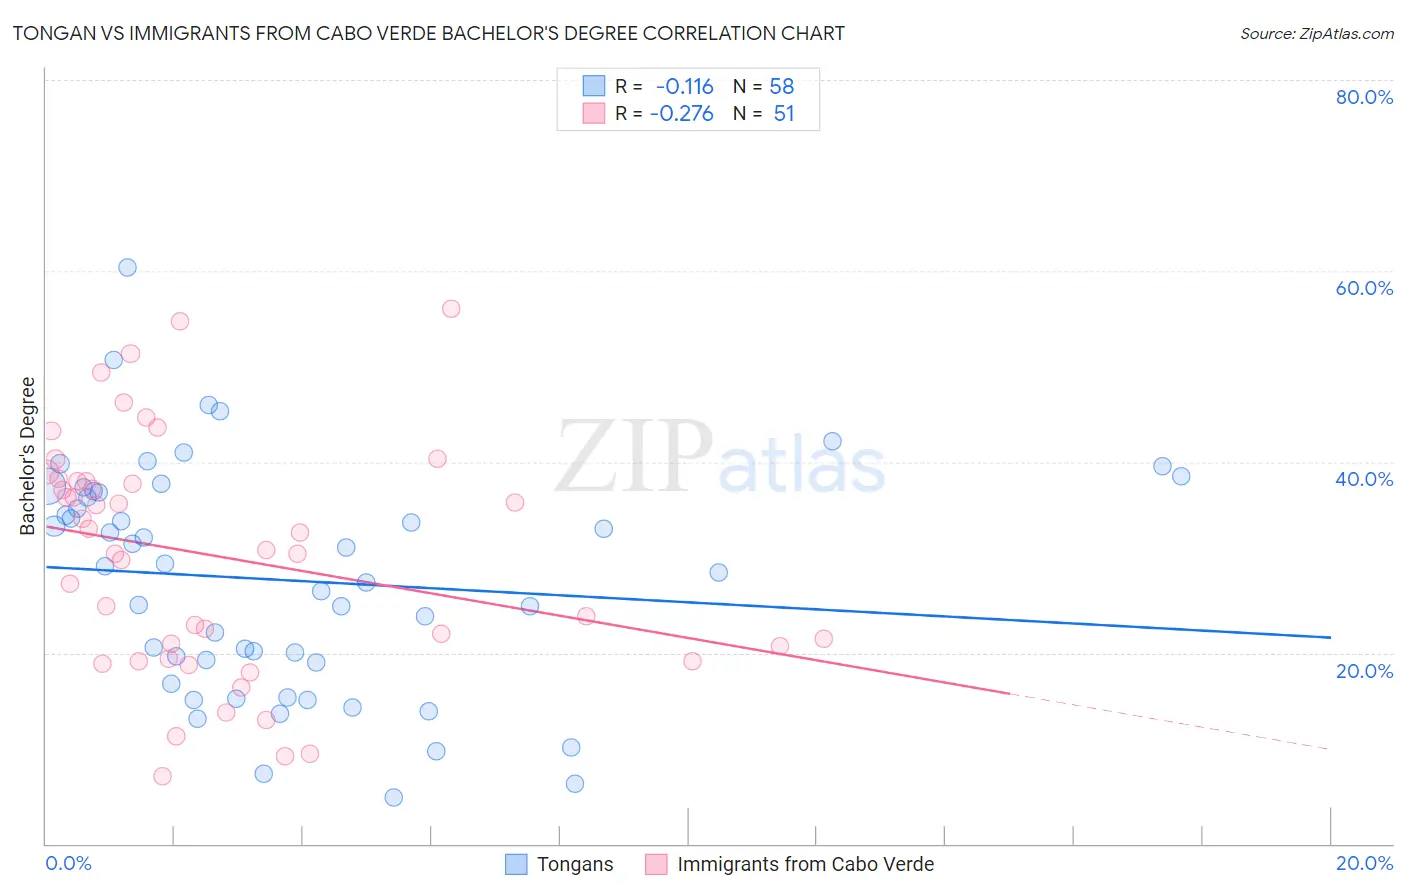
Tongan vs Immigrants from Cabo Verde Bachelor's Degree Correlation Chart
The statistical analysis conducted on geographies consisting of 102,908,079 people shows a poor negative correlation between the proportion of Tongans and percentage of population with at least bachelor's degree education in the United States with a correlation coefficient (R) of -0.116 and weighted average of 34.3%. Similarly, the statistical analysis conducted on geographies consisting of 38,158,316 people shows a weak negative correlation between the proportion of Immigrants from Cabo Verde and percentage of population with at least bachelor's degree education in the United States with a correlation coefficient (R) of -0.276 and weighted average of 29.2%, a difference of 17.2%.
Bachelor's Degree Correlation Summary
| Measurement | Tongan | Immigrants from Cabo Verde |
| Minimum | 4.8% | 7.1% |
| Maximum | 60.4% | 56.1% |
| Range | 55.6% | 49.0% |
| Mean | 27.6% | 30.1% |
| Median | 28.7% | 30.8% |
| Interquartile 25% (IQ1) | 19.0% | 19.4% |
| Interquartile 75% (IQ3) | 36.8% | 38.0% |
| Interquartile Range (IQR) | 17.8% | 18.6% |
| Standard Deviation (Sample) | 11.9% | 12.3% |
| Standard Deviation (Population) | 11.8% | 12.1% |
Similar Demographics by Bachelor's Degree
Demographics Similar to Tongans by Bachelor's Degree
In terms of bachelor's degree, the demographic groups most similar to Tongans are Immigrants from Cambodia (34.2%, a difference of 0.26%), Nonimmigrants (34.2%, a difference of 0.33%), British West Indian (34.5%, a difference of 0.54%), Guyanese (34.5%, a difference of 0.56%), and Tlingit-Haida (34.6%, a difference of 0.84%).
| Demographics | Rating | Rank | Bachelor's Degree |
| Immigrants | Ecuador | 3.3 /100 | #233 | Tragic 34.7% |
| Guamanians/Chamorros | 3.0 /100 | #234 | Tragic 34.6% |
| Immigrants | West Indies | 2.9 /100 | #235 | Tragic 34.6% |
| Liberians | 2.8 /100 | #236 | Tragic 34.6% |
| Tlingit-Haida | 2.8 /100 | #237 | Tragic 34.6% |
| Guyanese | 2.5 /100 | #238 | Tragic 34.5% |
| British West Indians | 2.5 /100 | #239 | Tragic 34.5% |
| Tongans | 2.0 /100 | #240 | Tragic 34.3% |
| Immigrants | Cambodia | 1.9 /100 | #241 | Tragic 34.2% |
| Immigrants | Nonimmigrants | 1.8 /100 | #242 | Tragic 34.2% |
| Immigrants | Guyana | 1.4 /100 | #243 | Tragic 33.9% |
| Delaware | 1.2 /100 | #244 | Tragic 33.8% |
| Immigrants | Fiji | 1.2 /100 | #245 | Tragic 33.7% |
| Jamaicans | 1.0 /100 | #246 | Tragic 33.6% |
| Immigrants | Congo | 1.0 /100 | #247 | Tragic 33.6% |
Demographics Similar to Immigrants from Cabo Verde by Bachelor's Degree
In terms of bachelor's degree, the demographic groups most similar to Immigrants from Cabo Verde are Shoshone (29.3%, a difference of 0.080%), Alaska Native (29.4%, a difference of 0.37%), Seminole (29.4%, a difference of 0.56%), Choctaw (29.4%, a difference of 0.61%), and Sioux (29.1%, a difference of 0.62%).
| Demographics | Rating | Rank | Bachelor's Degree |
| Cajuns | 0.0 /100 | #308 | Tragic 29.6% |
| Hispanics or Latinos | 0.0 /100 | #309 | Tragic 29.6% |
| Cheyenne | 0.0 /100 | #310 | Tragic 29.4% |
| Choctaw | 0.0 /100 | #311 | Tragic 29.4% |
| Seminole | 0.0 /100 | #312 | Tragic 29.4% |
| Alaska Natives | 0.0 /100 | #313 | Tragic 29.4% |
| Shoshone | 0.0 /100 | #314 | Tragic 29.3% |
| Immigrants | Cabo Verde | 0.0 /100 | #315 | Tragic 29.2% |
| Sioux | 0.0 /100 | #316 | Tragic 29.1% |
| Colville | 0.0 /100 | #317 | Tragic 29.0% |
| Yaqui | 0.0 /100 | #318 | Tragic 29.0% |
| Creek | 0.0 /100 | #319 | Tragic 28.9% |
| Kiowa | 0.0 /100 | #320 | Tragic 28.8% |
| Alaskan Athabascans | 0.0 /100 | #321 | Tragic 28.8% |
| Tsimshian | 0.0 /100 | #322 | Tragic 28.8% |