Immigrants vs Immigrants from Cabo Verde Bachelor's Degree
COMPARE
Immigrants
Immigrants from Cabo Verde
Bachelor's Degree
Bachelor's Degree Comparison
Immigrants
Immigrants from Cabo Verde
36.7%
BACHELOR'S DEGREE
22.8/ 100
METRIC RATING
204th/ 347
METRIC RANK
29.2%
BACHELOR'S DEGREE
0.0/ 100
METRIC RATING
315th/ 347
METRIC RANK
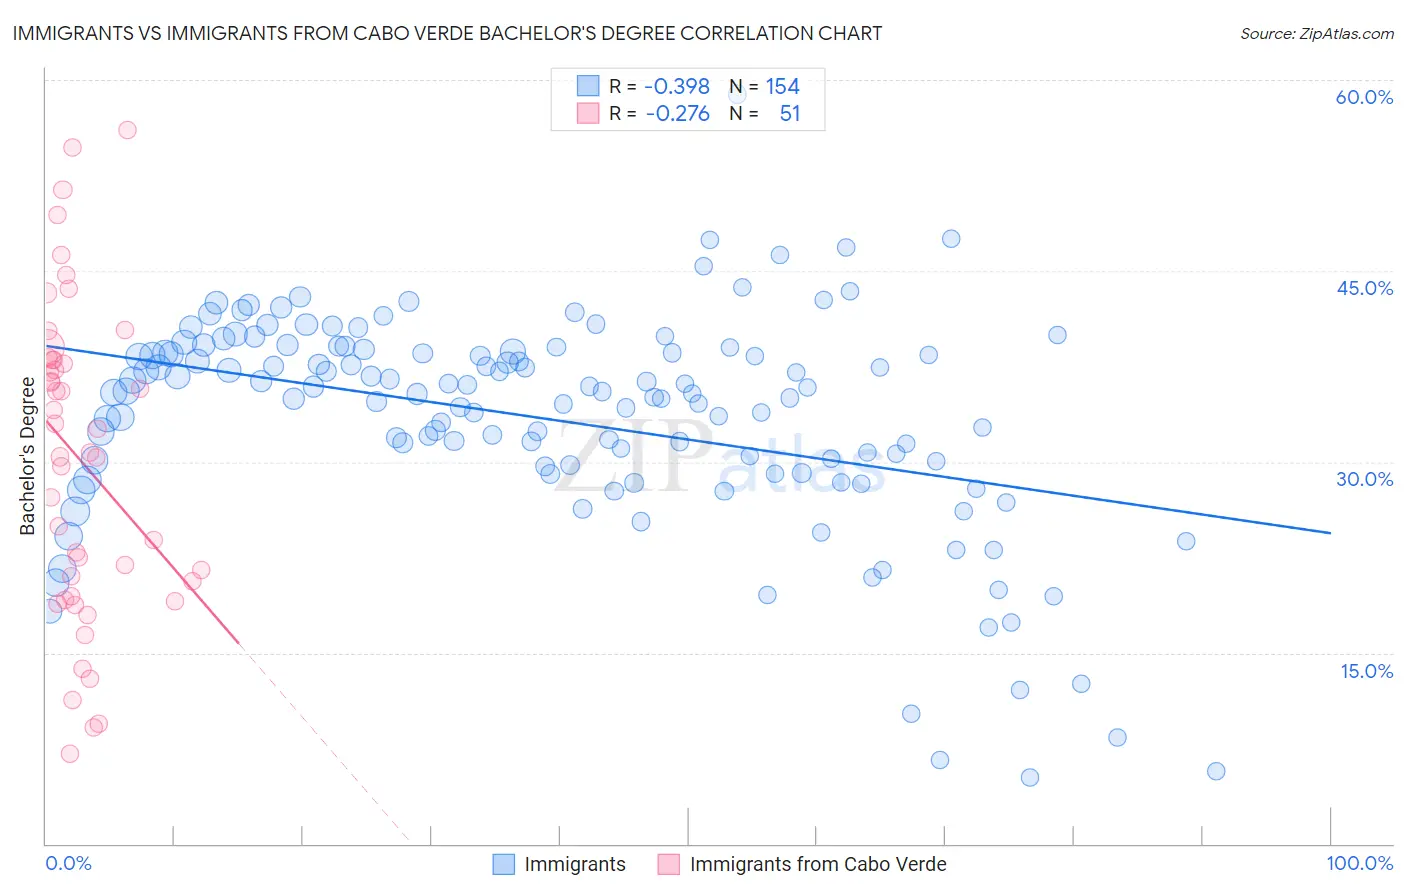
Immigrants vs Immigrants from Cabo Verde Bachelor's Degree Correlation Chart
The statistical analysis conducted on geographies consisting of 577,535,120 people shows a mild negative correlation between the proportion of Immigrants and percentage of population with at least bachelor's degree education in the United States with a correlation coefficient (R) of -0.398 and weighted average of 36.7%. Similarly, the statistical analysis conducted on geographies consisting of 38,158,316 people shows a weak negative correlation between the proportion of Immigrants from Cabo Verde and percentage of population with at least bachelor's degree education in the United States with a correlation coefficient (R) of -0.276 and weighted average of 29.2%, a difference of 25.5%.
Bachelor's Degree Correlation Summary
| Measurement | Immigrants | Immigrants from Cabo Verde |
| Minimum | 5.2% | 7.1% |
| Maximum | 58.9% | 56.1% |
| Range | 53.7% | 49.0% |
| Mean | 33.4% | 30.1% |
| Median | 35.4% | 30.8% |
| Interquartile 25% (IQ1) | 29.6% | 19.4% |
| Interquartile 75% (IQ3) | 38.6% | 38.0% |
| Interquartile Range (IQR) | 9.0% | 18.6% |
| Standard Deviation (Sample) | 8.6% | 12.3% |
| Standard Deviation (Population) | 8.6% | 12.1% |
Similar Demographics by Bachelor's Degree
Demographics Similar to Immigrants by Bachelor's Degree
In terms of bachelor's degree, the demographic groups most similar to Immigrants are Immigrants from Nigeria (36.7%, a difference of 0.040%), Finnish (36.7%, a difference of 0.10%), Spaniard (36.6%, a difference of 0.24%), Immigrants from Zaire (36.8%, a difference of 0.33%), and Immigrants from Middle Africa (36.6%, a difference of 0.33%).
| Demographics | Rating | Rank | Bachelor's Degree |
| Czechoslovakians | 29.2 /100 | #197 | Fair 37.0% |
| Welsh | 29.1 /100 | #198 | Fair 37.0% |
| Immigrants | Costa Rica | 27.4 /100 | #199 | Fair 36.9% |
| Immigrants | Ghana | 27.4 /100 | #200 | Fair 36.9% |
| Immigrants | South Eastern Asia | 25.4 /100 | #201 | Fair 36.8% |
| Immigrants | Zaire | 25.3 /100 | #202 | Fair 36.8% |
| Immigrants | Nigeria | 23.1 /100 | #203 | Fair 36.7% |
| Immigrants | Immigrants | 22.8 /100 | #204 | Fair 36.7% |
| Finns | 22.2 /100 | #205 | Fair 36.7% |
| Spaniards | 21.2 /100 | #206 | Fair 36.6% |
| Immigrants | Middle Africa | 20.6 /100 | #207 | Fair 36.6% |
| Immigrants | Thailand | 19.4 /100 | #208 | Poor 36.5% |
| Panamanians | 18.8 /100 | #209 | Poor 36.5% |
| French | 18.6 /100 | #210 | Poor 36.5% |
| Scotch-Irish | 18.3 /100 | #211 | Poor 36.4% |
Demographics Similar to Immigrants from Cabo Verde by Bachelor's Degree
In terms of bachelor's degree, the demographic groups most similar to Immigrants from Cabo Verde are Shoshone (29.3%, a difference of 0.080%), Alaska Native (29.4%, a difference of 0.37%), Seminole (29.4%, a difference of 0.56%), Choctaw (29.4%, a difference of 0.61%), and Sioux (29.1%, a difference of 0.62%).
| Demographics | Rating | Rank | Bachelor's Degree |
| Cajuns | 0.0 /100 | #308 | Tragic 29.6% |
| Hispanics or Latinos | 0.0 /100 | #309 | Tragic 29.6% |
| Cheyenne | 0.0 /100 | #310 | Tragic 29.4% |
| Choctaw | 0.0 /100 | #311 | Tragic 29.4% |
| Seminole | 0.0 /100 | #312 | Tragic 29.4% |
| Alaska Natives | 0.0 /100 | #313 | Tragic 29.4% |
| Shoshone | 0.0 /100 | #314 | Tragic 29.3% |
| Immigrants | Cabo Verde | 0.0 /100 | #315 | Tragic 29.2% |
| Sioux | 0.0 /100 | #316 | Tragic 29.1% |
| Colville | 0.0 /100 | #317 | Tragic 29.0% |
| Yaqui | 0.0 /100 | #318 | Tragic 29.0% |
| Creek | 0.0 /100 | #319 | Tragic 28.9% |
| Kiowa | 0.0 /100 | #320 | Tragic 28.8% |
| Alaskan Athabascans | 0.0 /100 | #321 | Tragic 28.8% |
| Tsimshian | 0.0 /100 | #322 | Tragic 28.8% |