Inupiat vs Immigrants from Cabo Verde Bachelor's Degree
COMPARE
Inupiat
Immigrants from Cabo Verde
Bachelor's Degree
Bachelor's Degree Comparison
Inupiat
Immigrants from Cabo Verde
25.8%
BACHELOR'S DEGREE
0.0/ 100
METRIC RATING
337th/ 347
METRIC RANK
29.2%
BACHELOR'S DEGREE
0.0/ 100
METRIC RATING
315th/ 347
METRIC RANK
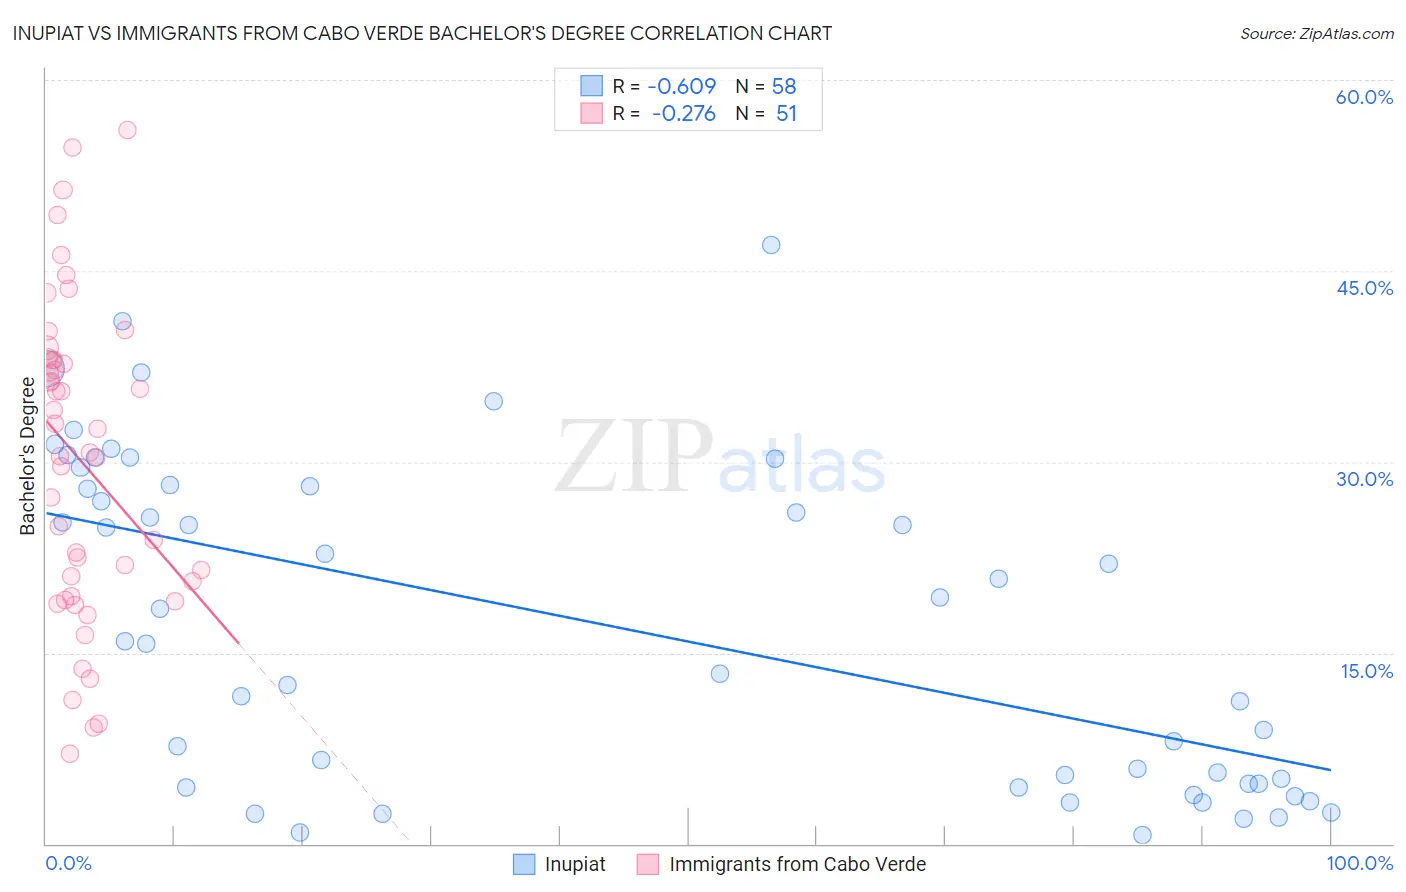
Inupiat vs Immigrants from Cabo Verde Bachelor's Degree Correlation Chart
The statistical analysis conducted on geographies consisting of 96,347,168 people shows a significant negative correlation between the proportion of Inupiat and percentage of population with at least bachelor's degree education in the United States with a correlation coefficient (R) of -0.609 and weighted average of 25.8%. Similarly, the statistical analysis conducted on geographies consisting of 38,158,316 people shows a weak negative correlation between the proportion of Immigrants from Cabo Verde and percentage of population with at least bachelor's degree education in the United States with a correlation coefficient (R) of -0.276 and weighted average of 29.2%, a difference of 13.3%.
Bachelor's Degree Correlation Summary
| Measurement | Inupiat | Immigrants from Cabo Verde |
| Minimum | 0.66% | 7.1% |
| Maximum | 47.0% | 56.1% |
| Range | 46.4% | 49.0% |
| Mean | 17.1% | 30.1% |
| Median | 15.8% | 30.8% |
| Interquartile 25% (IQ1) | 4.7% | 19.4% |
| Interquartile 75% (IQ3) | 28.1% | 38.0% |
| Interquartile Range (IQR) | 23.4% | 18.6% |
| Standard Deviation (Sample) | 12.7% | 12.3% |
| Standard Deviation (Population) | 12.6% | 12.1% |
Similar Demographics by Bachelor's Degree
Demographics Similar to Inupiat by Bachelor's Degree
In terms of bachelor's degree, the demographic groups most similar to Inupiat are Pueblo (25.5%, a difference of 1.1%), Immigrants from Mexico (26.1%, a difference of 1.3%), Native/Alaskan (26.3%, a difference of 2.0%), Hopi (25.3%, a difference of 2.0%), and Arapaho (26.6%, a difference of 3.2%).
| Demographics | Rating | Rank | Bachelor's Degree |
| Spanish American Indians | 0.0 /100 | #330 | Tragic 27.5% |
| Immigrants | Azores | 0.0 /100 | #331 | Tragic 27.3% |
| Menominee | 0.0 /100 | #332 | Tragic 27.3% |
| Mexicans | 0.0 /100 | #333 | Tragic 27.1% |
| Arapaho | 0.0 /100 | #334 | Tragic 26.6% |
| Natives/Alaskans | 0.0 /100 | #335 | Tragic 26.3% |
| Immigrants | Mexico | 0.0 /100 | #336 | Tragic 26.1% |
| Inupiat | 0.0 /100 | #337 | Tragic 25.8% |
| Pueblo | 0.0 /100 | #338 | Tragic 25.5% |
| Hopi | 0.0 /100 | #339 | Tragic 25.3% |
| Lumbee | 0.0 /100 | #340 | Tragic 24.8% |
| Yuman | 0.0 /100 | #341 | Tragic 24.5% |
| Yakama | 0.0 /100 | #342 | Tragic 24.5% |
| Tohono O'odham | 0.0 /100 | #343 | Tragic 24.4% |
| Navajo | 0.0 /100 | #344 | Tragic 23.6% |
Demographics Similar to Immigrants from Cabo Verde by Bachelor's Degree
In terms of bachelor's degree, the demographic groups most similar to Immigrants from Cabo Verde are Shoshone (29.3%, a difference of 0.080%), Alaska Native (29.4%, a difference of 0.37%), Seminole (29.4%, a difference of 0.56%), Choctaw (29.4%, a difference of 0.61%), and Sioux (29.1%, a difference of 0.62%).
| Demographics | Rating | Rank | Bachelor's Degree |
| Cajuns | 0.0 /100 | #308 | Tragic 29.6% |
| Hispanics or Latinos | 0.0 /100 | #309 | Tragic 29.6% |
| Cheyenne | 0.0 /100 | #310 | Tragic 29.4% |
| Choctaw | 0.0 /100 | #311 | Tragic 29.4% |
| Seminole | 0.0 /100 | #312 | Tragic 29.4% |
| Alaska Natives | 0.0 /100 | #313 | Tragic 29.4% |
| Shoshone | 0.0 /100 | #314 | Tragic 29.3% |
| Immigrants | Cabo Verde | 0.0 /100 | #315 | Tragic 29.2% |
| Sioux | 0.0 /100 | #316 | Tragic 29.1% |
| Colville | 0.0 /100 | #317 | Tragic 29.0% |
| Yaqui | 0.0 /100 | #318 | Tragic 29.0% |
| Creek | 0.0 /100 | #319 | Tragic 28.9% |
| Kiowa | 0.0 /100 | #320 | Tragic 28.8% |
| Alaskan Athabascans | 0.0 /100 | #321 | Tragic 28.8% |
| Tsimshian | 0.0 /100 | #322 | Tragic 28.8% |