Scottish vs Immigrants from Cabo Verde Professional Degree
COMPARE
Scottish
Immigrants from Cabo Verde
Professional Degree
Professional Degree Comparison
Scottish
Immigrants from Cabo Verde
4.6%
PROFESSIONAL DEGREE
71.8/ 100
METRIC RATING
154th/ 347
METRIC RANK
3.1%
PROFESSIONAL DEGREE
0.0/ 100
METRIC RATING
330th/ 347
METRIC RANK
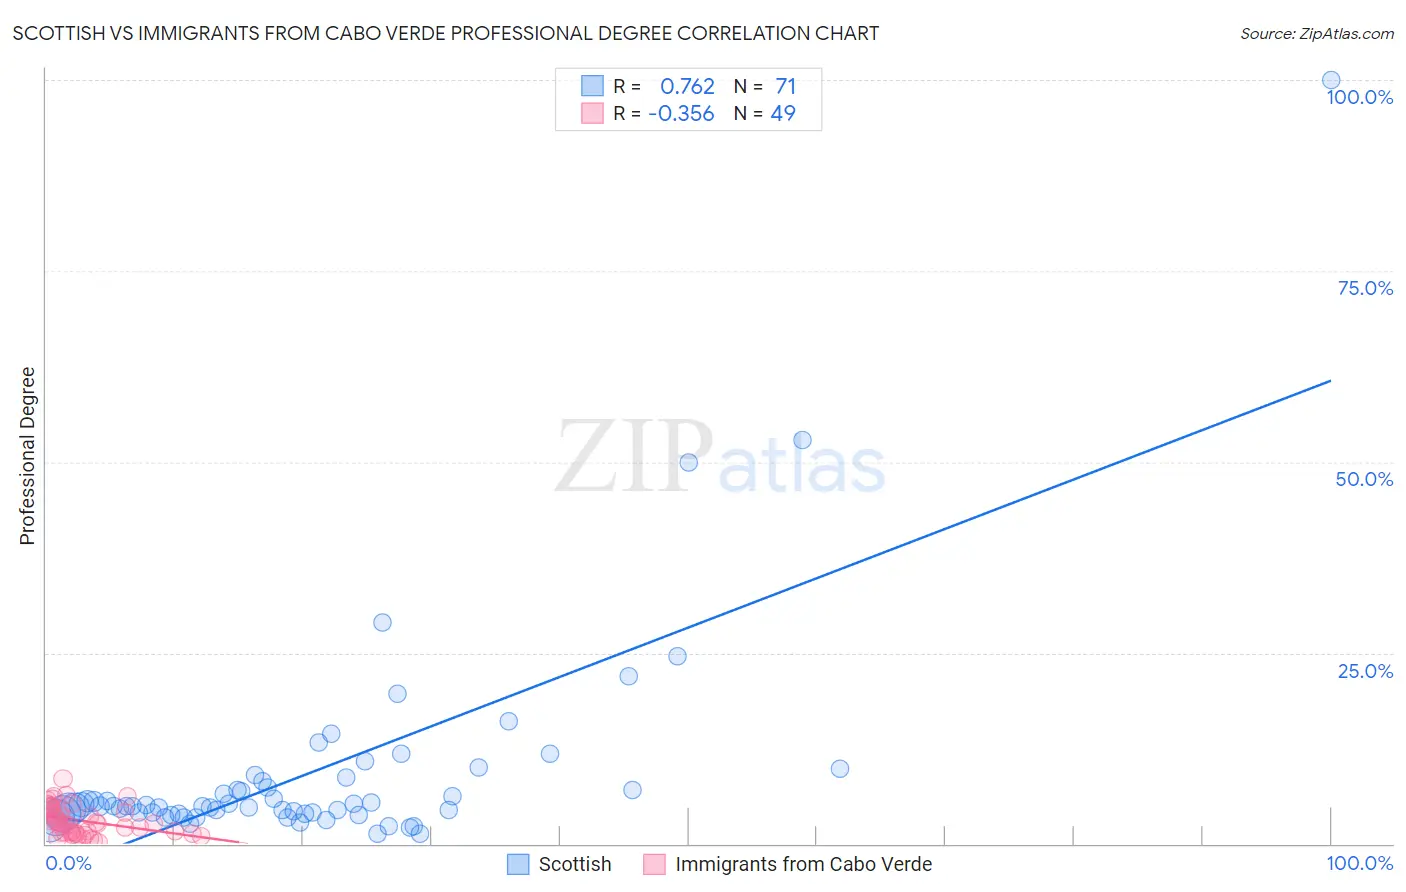
Scottish vs Immigrants from Cabo Verde Professional Degree Correlation Chart
The statistical analysis conducted on geographies consisting of 558,904,242 people shows a strong positive correlation between the proportion of Scottish and percentage of population with at least professional degree education in the United States with a correlation coefficient (R) of 0.762 and weighted average of 4.6%. Similarly, the statistical analysis conducted on geographies consisting of 38,118,065 people shows a mild negative correlation between the proportion of Immigrants from Cabo Verde and percentage of population with at least professional degree education in the United States with a correlation coefficient (R) of -0.356 and weighted average of 3.1%, a difference of 47.6%.
Professional Degree Correlation Summary
| Measurement | Scottish | Immigrants from Cabo Verde |
| Minimum | 1.3% | 0.14% |
| Maximum | 100.0% | 8.5% |
| Range | 98.7% | 8.3% |
| Mean | 9.2% | 3.0% |
| Median | 4.9% | 2.7% |
| Interquartile 25% (IQ1) | 4.0% | 1.4% |
| Interquartile 75% (IQ3) | 8.2% | 4.5% |
| Interquartile Range (IQR) | 4.2% | 3.1% |
| Standard Deviation (Sample) | 14.2% | 1.9% |
| Standard Deviation (Population) | 14.1% | 1.9% |
Similar Demographics by Professional Degree
Demographics Similar to Scottish by Professional Degree
In terms of professional degree, the demographic groups most similar to Scottish are Immigrants from Africa (4.6%, a difference of 0.12%), Immigrants from Uruguay (4.6%, a difference of 0.12%), Polish (4.6%, a difference of 0.14%), Slavic (4.5%, a difference of 0.18%), and Immigrants from Oceania (4.6%, a difference of 0.28%).
| Demographics | Rating | Rank | Professional Degree |
| Colombians | 77.7 /100 | #147 | Good 4.6% |
| Slovenes | 76.1 /100 | #148 | Good 4.6% |
| Senegalese | 75.3 /100 | #149 | Good 4.6% |
| Immigrants | Oceania | 73.4 /100 | #150 | Good 4.6% |
| Poles | 72.6 /100 | #151 | Good 4.6% |
| Immigrants | Africa | 72.5 /100 | #152 | Good 4.6% |
| Immigrants | Uruguay | 72.5 /100 | #153 | Good 4.6% |
| Scottish | 71.8 /100 | #154 | Good 4.6% |
| Slavs | 70.8 /100 | #155 | Good 4.5% |
| Swedes | 69.9 /100 | #156 | Good 4.5% |
| Iraqis | 69.8 /100 | #157 | Good 4.5% |
| Immigrants | Armenia | 68.8 /100 | #158 | Good 4.5% |
| Vietnamese | 68.4 /100 | #159 | Good 4.5% |
| Immigrants | Senegal | 68.0 /100 | #160 | Good 4.5% |
| Assyrians/Chaldeans/Syriacs | 67.4 /100 | #161 | Good 4.5% |
Demographics Similar to Immigrants from Cabo Verde by Professional Degree
In terms of professional degree, the demographic groups most similar to Immigrants from Cabo Verde are Bangladeshi (3.1%, a difference of 0.080%), Kiowa (3.1%, a difference of 0.12%), Yakama (3.1%, a difference of 0.23%), Puget Sound Salish (3.1%, a difference of 0.26%), and Creek (3.1%, a difference of 0.29%).
| Demographics | Rating | Rank | Professional Degree |
| Inupiat | 0.0 /100 | #323 | Tragic 3.2% |
| Crow | 0.0 /100 | #324 | Tragic 3.2% |
| Yaqui | 0.0 /100 | #325 | Tragic 3.2% |
| Menominee | 0.0 /100 | #326 | Tragic 3.1% |
| Dutch West Indians | 0.0 /100 | #327 | Tragic 3.1% |
| Creek | 0.0 /100 | #328 | Tragic 3.1% |
| Bangladeshis | 0.0 /100 | #329 | Tragic 3.1% |
| Immigrants | Cabo Verde | 0.0 /100 | #330 | Tragic 3.1% |
| Kiowa | 0.0 /100 | #331 | Tragic 3.1% |
| Yakama | 0.0 /100 | #332 | Tragic 3.1% |
| Puget Sound Salish | 0.0 /100 | #333 | Tragic 3.1% |
| Pennsylvania Germans | 0.0 /100 | #334 | Tragic 3.0% |
| Natives/Alaskans | 0.0 /100 | #335 | Tragic 3.0% |
| Fijians | 0.0 /100 | #336 | Tragic 2.9% |
| Arapaho | 0.0 /100 | #337 | Tragic 2.9% |