Puget Sound Salish vs Immigrants from Cabo Verde Bachelor's Degree
COMPARE
Puget Sound Salish
Immigrants from Cabo Verde
Bachelor's Degree
Bachelor's Degree Comparison
Puget Sound Salish
Immigrants from Cabo Verde
30.7%
BACHELOR'S DEGREE
0.0/ 100
METRIC RATING
296th/ 347
METRIC RANK
29.2%
BACHELOR'S DEGREE
0.0/ 100
METRIC RATING
315th/ 347
METRIC RANK
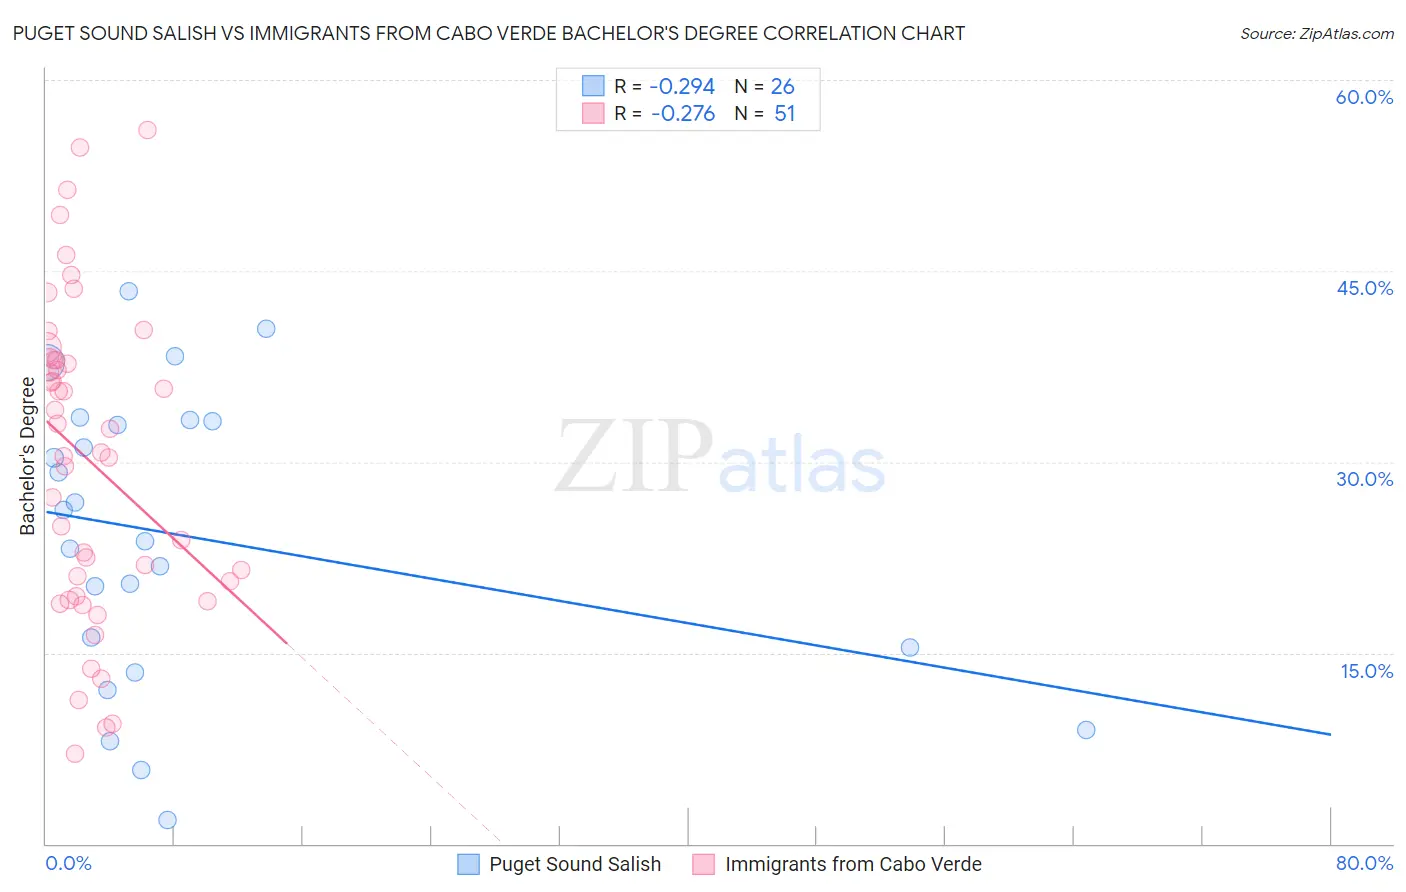
Puget Sound Salish vs Immigrants from Cabo Verde Bachelor's Degree Correlation Chart
The statistical analysis conducted on geographies consisting of 46,155,865 people shows a weak negative correlation between the proportion of Puget Sound Salish and percentage of population with at least bachelor's degree education in the United States with a correlation coefficient (R) of -0.294 and weighted average of 30.7%. Similarly, the statistical analysis conducted on geographies consisting of 38,158,316 people shows a weak negative correlation between the proportion of Immigrants from Cabo Verde and percentage of population with at least bachelor's degree education in the United States with a correlation coefficient (R) of -0.276 and weighted average of 29.2%, a difference of 4.8%.
Bachelor's Degree Correlation Summary
| Measurement | Puget Sound Salish | Immigrants from Cabo Verde |
| Minimum | 1.9% | 7.1% |
| Maximum | 43.4% | 56.1% |
| Range | 41.6% | 49.0% |
| Mean | 24.1% | 30.1% |
| Median | 25.0% | 30.8% |
| Interquartile 25% (IQ1) | 15.4% | 19.4% |
| Interquartile 75% (IQ3) | 33.2% | 38.0% |
| Interquartile Range (IQR) | 17.8% | 18.6% |
| Standard Deviation (Sample) | 11.4% | 12.3% |
| Standard Deviation (Population) | 11.2% | 12.1% |
Demographics Similar to Puget Sound Salish and Immigrants from Cabo Verde by Bachelor's Degree
In terms of bachelor's degree, the demographic groups most similar to Puget Sound Salish are Immigrants from Haiti (30.6%, a difference of 0.060%), Immigrants from Dominican Republic (30.7%, a difference of 0.10%), Chippewa (30.6%, a difference of 0.31%), Chickasaw (30.4%, a difference of 0.83%), and Immigrants from Micronesia (30.4%, a difference of 0.85%). Similarly, the demographic groups most similar to Immigrants from Cabo Verde are Shoshone (29.3%, a difference of 0.080%), Alaska Native (29.4%, a difference of 0.37%), Seminole (29.4%, a difference of 0.56%), Choctaw (29.4%, a difference of 0.61%), and Cheyenne (29.4%, a difference of 0.68%).
| Demographics | Rating | Rank | Bachelor's Degree |
| Immigrants | Dominican Republic | 0.0 /100 | #295 | Tragic 30.7% |
| Puget Sound Salish | 0.0 /100 | #296 | Tragic 30.7% |
| Immigrants | Haiti | 0.0 /100 | #297 | Tragic 30.6% |
| Chippewa | 0.0 /100 | #298 | Tragic 30.6% |
| Chickasaw | 0.0 /100 | #299 | Tragic 30.4% |
| Immigrants | Micronesia | 0.0 /100 | #300 | Tragic 30.4% |
| Immigrants | Cuba | 0.0 /100 | #301 | Tragic 30.3% |
| Mexican American Indians | 0.0 /100 | #302 | Tragic 30.2% |
| Bangladeshis | 0.0 /100 | #303 | Tragic 30.2% |
| Cherokee | 0.0 /100 | #304 | Tragic 30.2% |
| Immigrants | Latin America | 0.0 /100 | #305 | Tragic 30.1% |
| Immigrants | Yemen | 0.0 /100 | #306 | Tragic 29.9% |
| Nepalese | 0.0 /100 | #307 | Tragic 29.9% |
| Cajuns | 0.0 /100 | #308 | Tragic 29.6% |
| Hispanics or Latinos | 0.0 /100 | #309 | Tragic 29.6% |
| Cheyenne | 0.0 /100 | #310 | Tragic 29.4% |
| Choctaw | 0.0 /100 | #311 | Tragic 29.4% |
| Seminole | 0.0 /100 | #312 | Tragic 29.4% |
| Alaska Natives | 0.0 /100 | #313 | Tragic 29.4% |
| Shoshone | 0.0 /100 | #314 | Tragic 29.3% |
| Immigrants | Cabo Verde | 0.0 /100 | #315 | Tragic 29.2% |