Cape Verdean vs Immigrants from Cabo Verde Bachelor's Degree
COMPARE
Cape Verdean
Immigrants from Cabo Verde
Bachelor's Degree
Bachelor's Degree Comparison
Cape Verdeans
Immigrants from Cabo Verde
30.9%
BACHELOR'S DEGREE
0.1/ 100
METRIC RATING
293rd/ 347
METRIC RANK
29.2%
BACHELOR'S DEGREE
0.0/ 100
METRIC RATING
315th/ 347
METRIC RANK
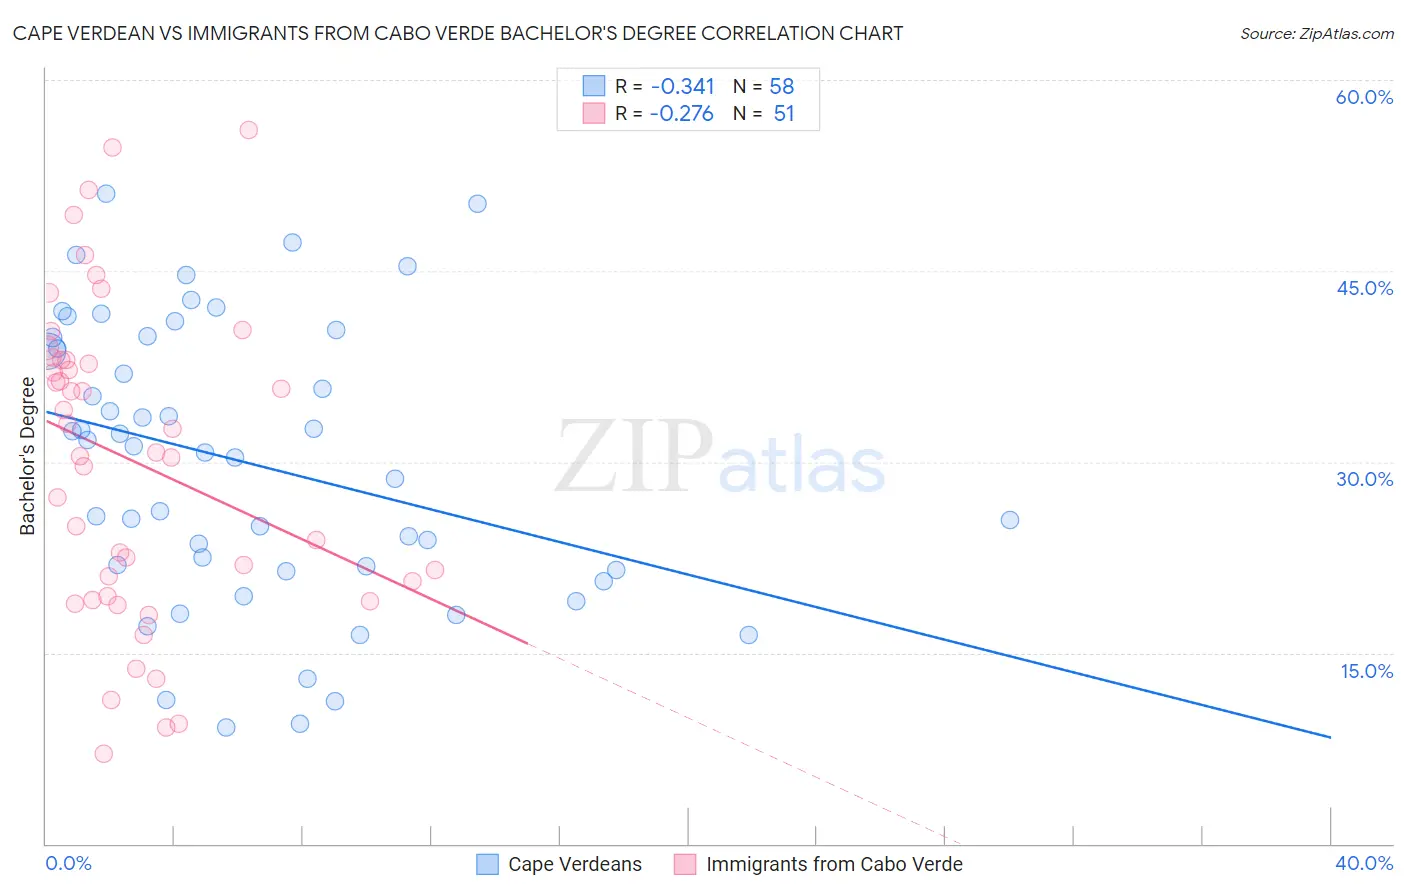
Cape Verdean vs Immigrants from Cabo Verde Bachelor's Degree Correlation Chart
The statistical analysis conducted on geographies consisting of 107,579,192 people shows a mild negative correlation between the proportion of Cape Verdeans and percentage of population with at least bachelor's degree education in the United States with a correlation coefficient (R) of -0.341 and weighted average of 30.9%. Similarly, the statistical analysis conducted on geographies consisting of 38,158,316 people shows a weak negative correlation between the proportion of Immigrants from Cabo Verde and percentage of population with at least bachelor's degree education in the United States with a correlation coefficient (R) of -0.276 and weighted average of 29.2%, a difference of 5.6%.
Bachelor's Degree Correlation Summary
| Measurement | Cape Verdean | Immigrants from Cabo Verde |
| Minimum | 9.1% | 7.1% |
| Maximum | 51.0% | 56.1% |
| Range | 41.9% | 49.0% |
| Mean | 29.9% | 30.1% |
| Median | 31.0% | 30.8% |
| Interquartile 25% (IQ1) | 21.5% | 19.4% |
| Interquartile 75% (IQ3) | 39.7% | 38.0% |
| Interquartile Range (IQR) | 18.2% | 18.6% |
| Standard Deviation (Sample) | 11.0% | 12.3% |
| Standard Deviation (Population) | 10.9% | 12.1% |
Similar Demographics by Bachelor's Degree
Demographics Similar to Cape Verdeans by Bachelor's Degree
In terms of bachelor's degree, the demographic groups most similar to Cape Verdeans are Ute (30.9%, a difference of 0.090%), Black/African American (30.9%, a difference of 0.18%), Immigrants from Honduras (30.9%, a difference of 0.21%), Puerto Rican (31.0%, a difference of 0.26%), and Guatemalan (31.0%, a difference of 0.40%).
| Demographics | Rating | Rank | Bachelor's Degree |
| Immigrants | El Salvador | 0.1 /100 | #286 | Tragic 31.3% |
| Ottawa | 0.1 /100 | #287 | Tragic 31.1% |
| Guatemalans | 0.1 /100 | #288 | Tragic 31.0% |
| Puerto Ricans | 0.1 /100 | #289 | Tragic 31.0% |
| Immigrants | Honduras | 0.1 /100 | #290 | Tragic 30.9% |
| Blacks/African Americans | 0.1 /100 | #291 | Tragic 30.9% |
| Ute | 0.1 /100 | #292 | Tragic 30.9% |
| Cape Verdeans | 0.1 /100 | #293 | Tragic 30.9% |
| Immigrants | Guatemala | 0.0 /100 | #294 | Tragic 30.8% |
| Immigrants | Dominican Republic | 0.0 /100 | #295 | Tragic 30.7% |
| Puget Sound Salish | 0.0 /100 | #296 | Tragic 30.7% |
| Immigrants | Haiti | 0.0 /100 | #297 | Tragic 30.6% |
| Chippewa | 0.0 /100 | #298 | Tragic 30.6% |
| Chickasaw | 0.0 /100 | #299 | Tragic 30.4% |
| Immigrants | Micronesia | 0.0 /100 | #300 | Tragic 30.4% |
Demographics Similar to Immigrants from Cabo Verde by Bachelor's Degree
In terms of bachelor's degree, the demographic groups most similar to Immigrants from Cabo Verde are Shoshone (29.3%, a difference of 0.080%), Alaska Native (29.4%, a difference of 0.37%), Seminole (29.4%, a difference of 0.56%), Choctaw (29.4%, a difference of 0.61%), and Sioux (29.1%, a difference of 0.62%).
| Demographics | Rating | Rank | Bachelor's Degree |
| Cajuns | 0.0 /100 | #308 | Tragic 29.6% |
| Hispanics or Latinos | 0.0 /100 | #309 | Tragic 29.6% |
| Cheyenne | 0.0 /100 | #310 | Tragic 29.4% |
| Choctaw | 0.0 /100 | #311 | Tragic 29.4% |
| Seminole | 0.0 /100 | #312 | Tragic 29.4% |
| Alaska Natives | 0.0 /100 | #313 | Tragic 29.4% |
| Shoshone | 0.0 /100 | #314 | Tragic 29.3% |
| Immigrants | Cabo Verde | 0.0 /100 | #315 | Tragic 29.2% |
| Sioux | 0.0 /100 | #316 | Tragic 29.1% |
| Colville | 0.0 /100 | #317 | Tragic 29.0% |
| Yaqui | 0.0 /100 | #318 | Tragic 29.0% |
| Creek | 0.0 /100 | #319 | Tragic 28.9% |
| Kiowa | 0.0 /100 | #320 | Tragic 28.8% |
| Alaskan Athabascans | 0.0 /100 | #321 | Tragic 28.8% |
| Tsimshian | 0.0 /100 | #322 | Tragic 28.8% |