Okinawan vs Immigrants from Austria 11th Grade
COMPARE
Okinawan
Immigrants from Austria
11th Grade
11th Grade Comparison
Okinawans
Immigrants from Austria
94.0%
11TH GRADE
99.8/ 100
METRIC RATING
60th/ 347
METRIC RANK
94.1%
11TH GRADE
99.9/ 100
METRIC RATING
42nd/ 347
METRIC RANK
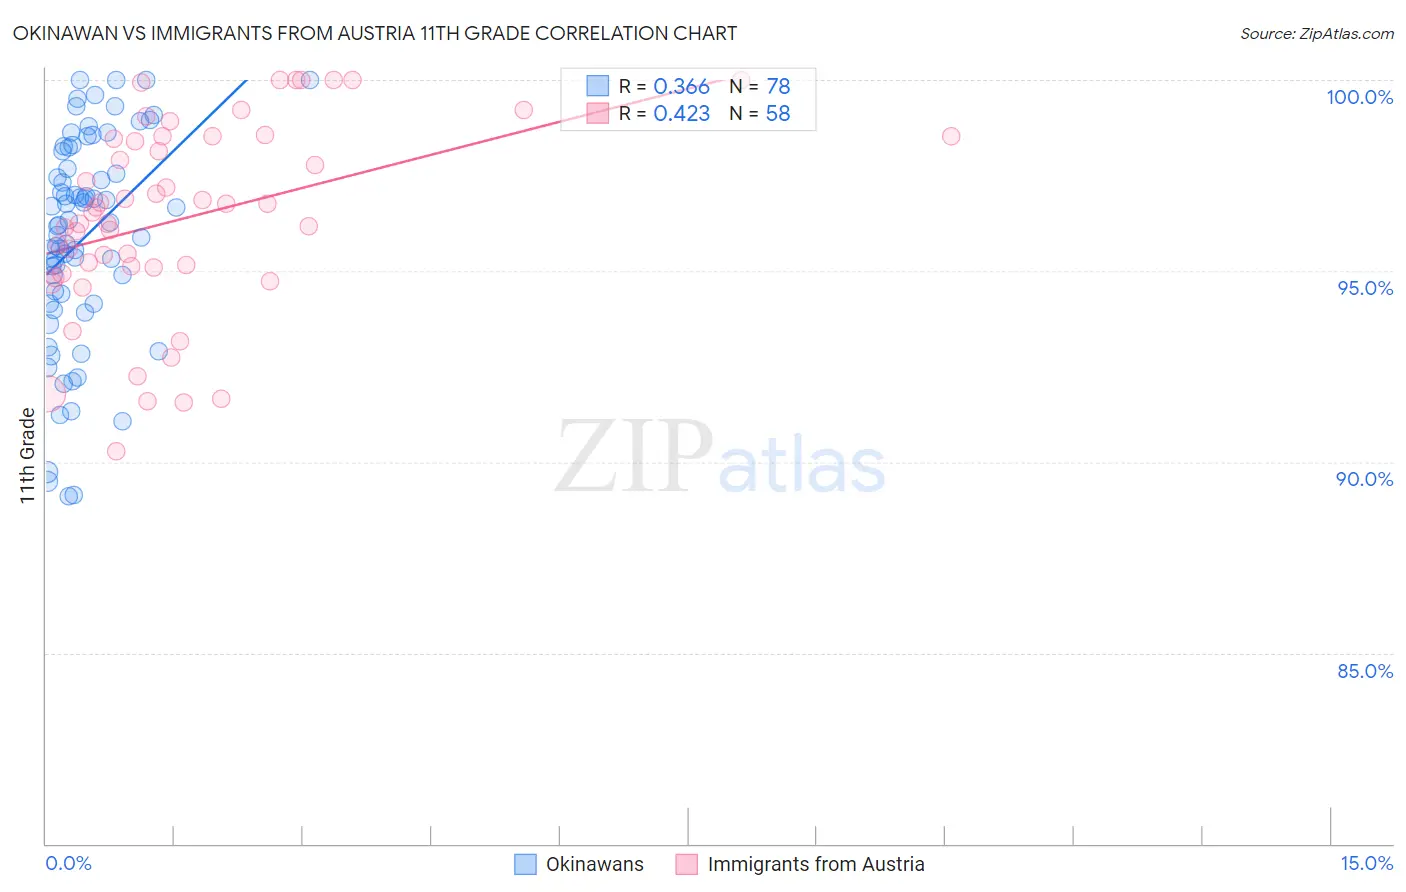
Okinawan vs Immigrants from Austria 11th Grade Correlation Chart
The statistical analysis conducted on geographies consisting of 73,775,797 people shows a mild positive correlation between the proportion of Okinawans and percentage of population with at least 11th grade education in the United States with a correlation coefficient (R) of 0.366 and weighted average of 94.0%. Similarly, the statistical analysis conducted on geographies consisting of 167,973,618 people shows a moderate positive correlation between the proportion of Immigrants from Austria and percentage of population with at least 11th grade education in the United States with a correlation coefficient (R) of 0.423 and weighted average of 94.1%, a difference of 0.13%.
11th Grade Correlation Summary
| Measurement | Okinawan | Immigrants from Austria |
| Minimum | 89.1% | 90.3% |
| Maximum | 100.0% | 100.0% |
| Range | 10.9% | 9.7% |
| Mean | 95.9% | 96.4% |
| Median | 96.2% | 96.6% |
| Interquartile 25% (IQ1) | 94.1% | 95.1% |
| Interquartile 75% (IQ3) | 98.1% | 98.5% |
| Interquartile Range (IQR) | 4.0% | 3.5% |
| Standard Deviation (Sample) | 2.8% | 2.5% |
| Standard Deviation (Population) | 2.7% | 2.5% |
Demographics Similar to Okinawans and Immigrants from Austria by 11th Grade
In terms of 11th grade, the demographic groups most similar to Okinawans are French Canadian (94.0%, a difference of 0.0%), New Zealander (94.0%, a difference of 0.0%), Iranian (94.0%, a difference of 0.0%), Bhutanese (94.0%, a difference of 0.0%), and Immigrants from North America (94.0%, a difference of 0.010%). Similarly, the demographic groups most similar to Immigrants from Austria are Cypriot (94.1%, a difference of 0.010%), Greek (94.1%, a difference of 0.010%), Immigrants from Ireland (94.1%, a difference of 0.020%), Australian (94.1%, a difference of 0.030%), and Serbian (94.1%, a difference of 0.040%).
| Demographics | Rating | Rank | 11th Grade |
| Cypriots | 99.9 /100 | #41 | Exceptional 94.1% |
| Immigrants | Austria | 99.9 /100 | #42 | Exceptional 94.1% |
| Greeks | 99.9 /100 | #43 | Exceptional 94.1% |
| Immigrants | Ireland | 99.9 /100 | #44 | Exceptional 94.1% |
| Australians | 99.9 /100 | #45 | Exceptional 94.1% |
| Serbians | 99.9 /100 | #46 | Exceptional 94.1% |
| Filipinos | 99.9 /100 | #47 | Exceptional 94.1% |
| Macedonians | 99.9 /100 | #48 | Exceptional 94.1% |
| Slavs | 99.9 /100 | #49 | Exceptional 94.1% |
| French | 99.9 /100 | #50 | Exceptional 94.1% |
| Turks | 99.9 /100 | #51 | Exceptional 94.0% |
| Immigrants | Canada | 99.9 /100 | #52 | Exceptional 94.0% |
| Immigrants | Australia | 99.9 /100 | #53 | Exceptional 94.0% |
| Immigrants | North America | 99.9 /100 | #54 | Exceptional 94.0% |
| Czechoslovakians | 99.9 /100 | #55 | Exceptional 94.0% |
| French Canadians | 99.9 /100 | #56 | Exceptional 94.0% |
| New Zealanders | 99.9 /100 | #57 | Exceptional 94.0% |
| Iranians | 99.9 /100 | #58 | Exceptional 94.0% |
| Bhutanese | 99.8 /100 | #59 | Exceptional 94.0% |
| Okinawans | 99.8 /100 | #60 | Exceptional 94.0% |
| Immigrants | Belgium | 99.8 /100 | #61 | Exceptional 94.0% |