Scotch-Irish vs Taiwanese College, Under 1 year
COMPARE
Scotch-Irish
Taiwanese
College, Under 1 year
College, Under 1 year Comparison
Scotch-Irish
Taiwanese
65.4%
COLLEGE, UNDER 1 YEAR
49.5/ 100
METRIC RATING
175th/ 347
METRIC RANK
66.4%
COLLEGE, UNDER 1 YEAR
78.6/ 100
METRIC RATING
148th/ 347
METRIC RANK
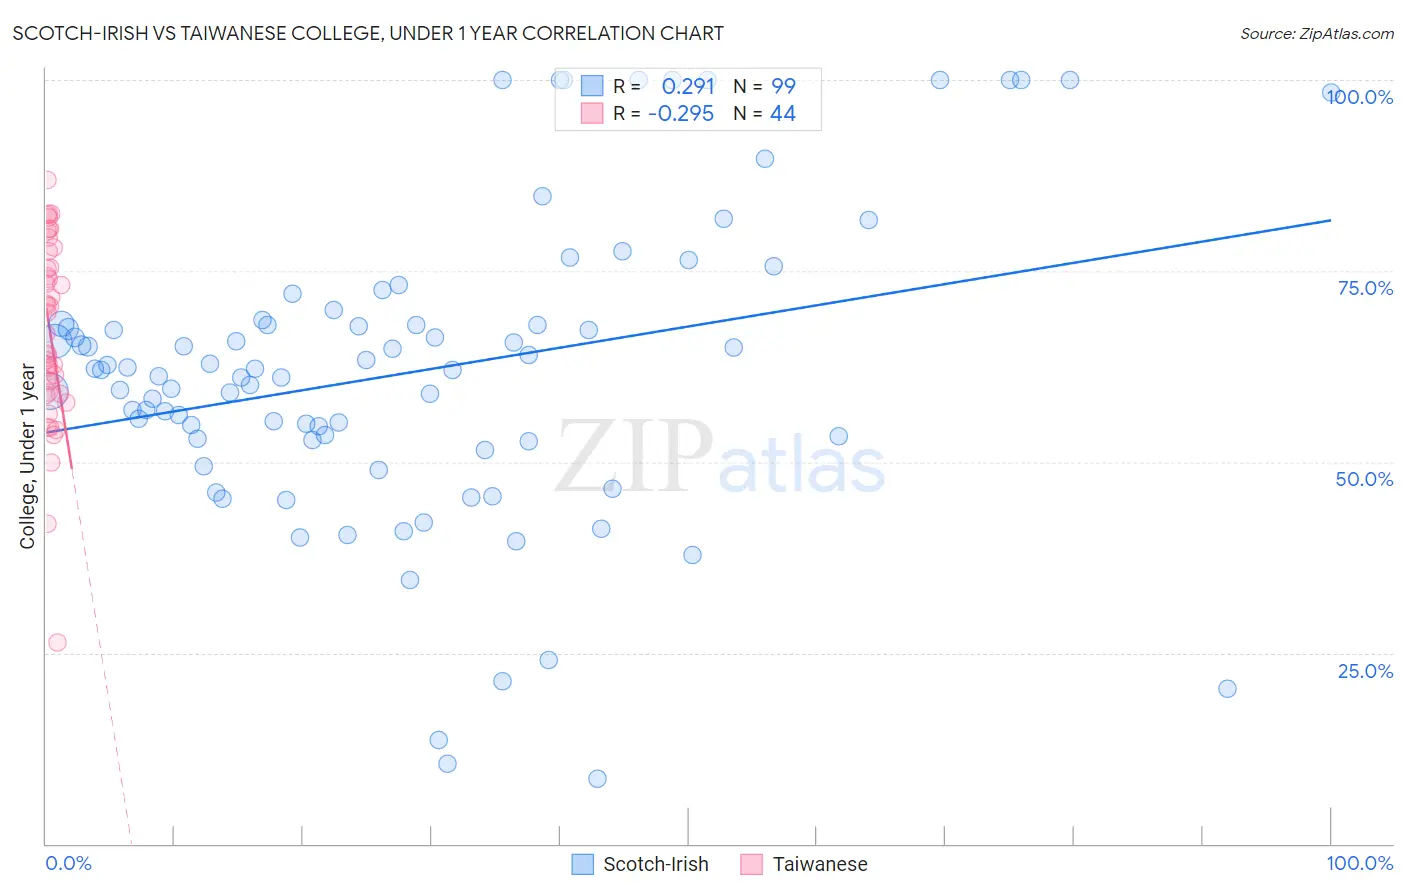
Scotch-Irish vs Taiwanese College, Under 1 year Correlation Chart
The statistical analysis conducted on geographies consisting of 548,775,844 people shows a weak positive correlation between the proportion of Scotch-Irish and percentage of population with at least college, under 1 year education in the United States with a correlation coefficient (R) of 0.291 and weighted average of 65.4%. Similarly, the statistical analysis conducted on geographies consisting of 31,724,936 people shows a weak negative correlation between the proportion of Taiwanese and percentage of population with at least college, under 1 year education in the United States with a correlation coefficient (R) of -0.295 and weighted average of 66.4%, a difference of 1.5%.
College, Under 1 year Correlation Summary
| Measurement | Scotch-Irish | Taiwanese |
| Minimum | 8.6% | 26.4% |
| Maximum | 100.0% | 86.9% |
| Range | 91.4% | 60.6% |
| Mean | 61.8% | 66.9% |
| Median | 62.1% | 68.2% |
| Interquartile 25% (IQ1) | 52.8% | 58.9% |
| Interquartile 75% (IQ3) | 68.1% | 76.5% |
| Interquartile Range (IQR) | 15.3% | 17.6% |
| Standard Deviation (Sample) | 20.0% | 12.3% |
| Standard Deviation (Population) | 19.9% | 12.1% |
Similar Demographics by College, Under 1 year
Demographics Similar to Scotch-Irish by College, Under 1 year
In terms of college, under 1 year, the demographic groups most similar to Scotch-Irish are Immigrants from Bosnia and Herzegovina (65.4%, a difference of 0.020%), French (65.4%, a difference of 0.030%), Immigrants from North Macedonia (65.4%, a difference of 0.040%), German Russian (65.4%, a difference of 0.050%), and Guamanian/Chamorro (65.4%, a difference of 0.060%).
| Demographics | Rating | Rank | College, Under 1 year |
| Hungarians | 55.9 /100 | #168 | Average 65.6% |
| Yugoslavians | 55.7 /100 | #169 | Average 65.6% |
| Germans | 55.7 /100 | #170 | Average 65.6% |
| Immigrants | Oceania | 55.0 /100 | #171 | Average 65.6% |
| South American Indians | 54.4 /100 | #172 | Average 65.5% |
| Swiss | 53.9 /100 | #173 | Average 65.5% |
| Immigrants | Bosnia and Herzegovina | 50.0 /100 | #174 | Average 65.4% |
| Scotch-Irish | 49.5 /100 | #175 | Average 65.4% |
| French | 48.9 /100 | #176 | Average 65.4% |
| Immigrants | North Macedonia | 48.6 /100 | #177 | Average 65.4% |
| German Russians | 48.3 /100 | #178 | Average 65.4% |
| Guamanians/Chamorros | 48.2 /100 | #179 | Average 65.4% |
| Dutch | 46.1 /100 | #180 | Average 65.3% |
| Spaniards | 45.5 /100 | #181 | Average 65.3% |
| Immigrants | Africa | 44.7 /100 | #182 | Average 65.3% |
Demographics Similar to Taiwanese by College, Under 1 year
In terms of college, under 1 year, the demographic groups most similar to Taiwanese are Immigrants from Venezuela (66.3%, a difference of 0.040%), Immigrants from Iraq (66.3%, a difference of 0.090%), Immigrants from Sudan (66.2%, a difference of 0.16%), Kenyan (66.5%, a difference of 0.21%), and Immigrants from Morocco (66.5%, a difference of 0.21%).
| Demographics | Rating | Rank | College, Under 1 year |
| Immigrants | Afghanistan | 85.1 /100 | #141 | Excellent 66.7% |
| English | 82.9 /100 | #142 | Excellent 66.6% |
| Immigrants | Uganda | 82.8 /100 | #143 | Excellent 66.5% |
| Immigrants | Germany | 82.0 /100 | #144 | Excellent 66.5% |
| Immigrants | Kenya | 81.8 /100 | #145 | Excellent 66.5% |
| Kenyans | 81.7 /100 | #146 | Excellent 66.5% |
| Immigrants | Morocco | 81.7 /100 | #147 | Excellent 66.5% |
| Taiwanese | 78.6 /100 | #148 | Good 66.4% |
| Immigrants | Venezuela | 77.9 /100 | #149 | Good 66.3% |
| Immigrants | Iraq | 77.1 /100 | #150 | Good 66.3% |
| Immigrants | Sudan | 76.0 /100 | #151 | Good 66.2% |
| Sudanese | 74.1 /100 | #152 | Good 66.2% |
| Belgians | 73.7 /100 | #153 | Good 66.2% |
| Immigrants | Eritrea | 71.9 /100 | #154 | Good 66.1% |
| Irish | 70.3 /100 | #155 | Good 66.0% |