Czechoslovakian vs Greek College, Under 1 year
COMPARE
Czechoslovakian
Greek
College, Under 1 year
College, Under 1 year Comparison
Czechoslovakians
Greeks
65.8%
COLLEGE, UNDER 1 YEAR
62.6/ 100
METRIC RATING
164th/ 347
METRIC RANK
68.5%
COLLEGE, UNDER 1 YEAR
98.6/ 100
METRIC RATING
79th/ 347
METRIC RANK
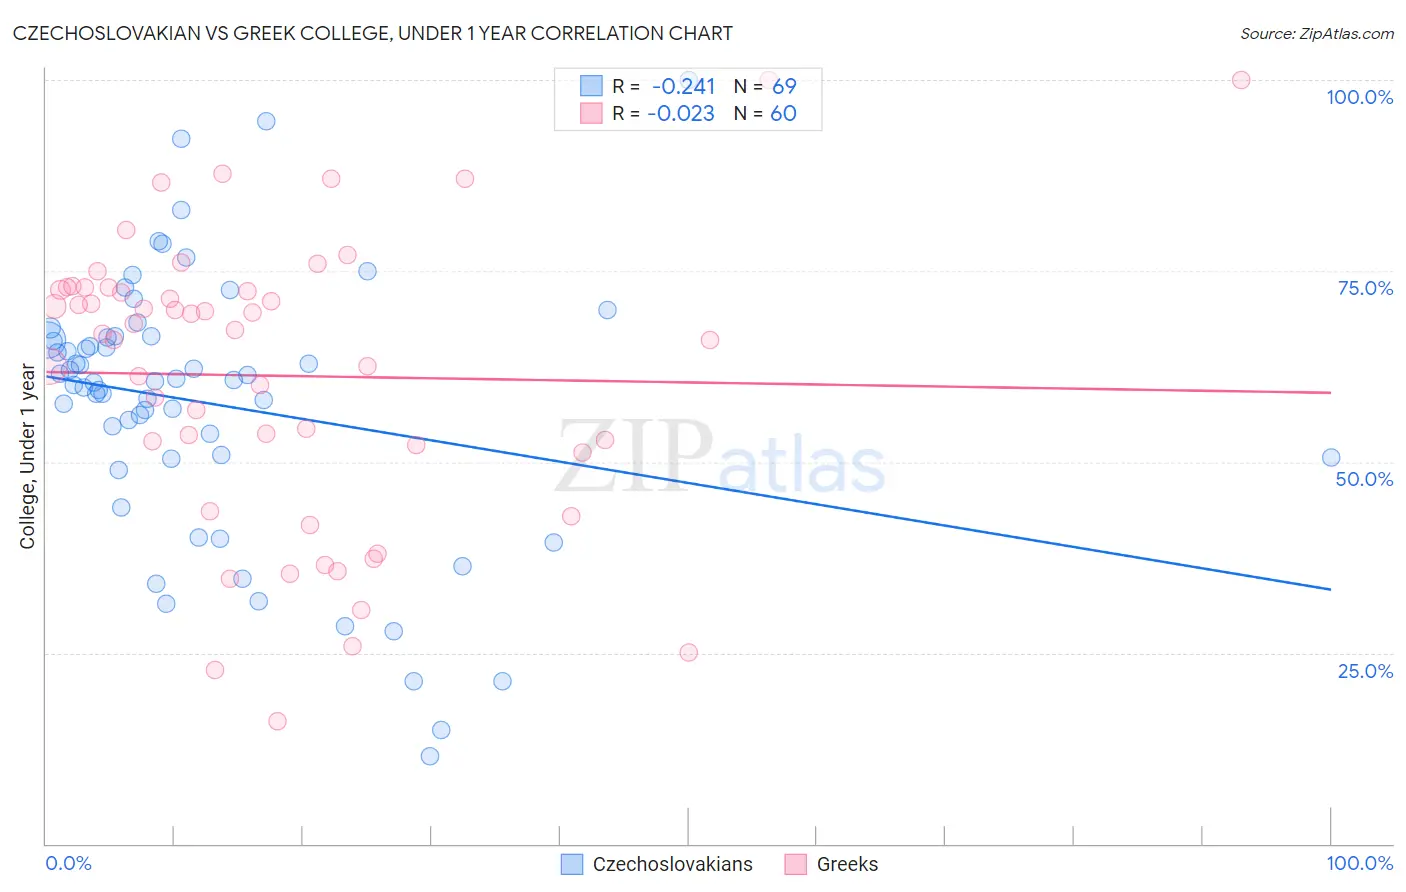
Czechoslovakian vs Greek College, Under 1 year Correlation Chart
The statistical analysis conducted on geographies consisting of 368,667,204 people shows a weak negative correlation between the proportion of Czechoslovakians and percentage of population with at least college, under 1 year education in the United States with a correlation coefficient (R) of -0.241 and weighted average of 65.8%. Similarly, the statistical analysis conducted on geographies consisting of 482,772,092 people shows no correlation between the proportion of Greeks and percentage of population with at least college, under 1 year education in the United States with a correlation coefficient (R) of -0.023 and weighted average of 68.5%, a difference of 4.1%.
College, Under 1 year Correlation Summary
| Measurement | Czechoslovakian | Greek |
| Minimum | 11.5% | 16.1% |
| Maximum | 100.0% | 100.0% |
| Range | 88.5% | 83.9% |
| Mean | 57.6% | 61.3% |
| Median | 60.6% | 67.1% |
| Interquartile 25% (IQ1) | 50.4% | 51.7% |
| Interquartile 75% (IQ3) | 66.4% | 72.6% |
| Interquartile Range (IQR) | 15.9% | 21.0% |
| Standard Deviation (Sample) | 17.7% | 18.9% |
| Standard Deviation (Population) | 17.6% | 18.8% |
Similar Demographics by College, Under 1 year
Demographics Similar to Czechoslovakians by College, Under 1 year
In terms of college, under 1 year, the demographic groups most similar to Czechoslovakians are Somali (65.8%, a difference of 0.010%), Immigrants from Uzbekistan (65.8%, a difference of 0.050%), Korean (65.9%, a difference of 0.13%), Brazilian (65.9%, a difference of 0.16%), and Albanian (65.9%, a difference of 0.17%).
| Demographics | Rating | Rank | College, Under 1 year |
| Sierra Leoneans | 67.8 /100 | #157 | Good 66.0% |
| Celtics | 67.3 /100 | #158 | Good 65.9% |
| Tlingit-Haida | 66.4 /100 | #159 | Good 65.9% |
| Albanians | 66.1 /100 | #160 | Good 65.9% |
| Brazilians | 66.0 /100 | #161 | Good 65.9% |
| Koreans | 65.3 /100 | #162 | Good 65.9% |
| Somalis | 62.7 /100 | #163 | Good 65.8% |
| Czechoslovakians | 62.6 /100 | #164 | Good 65.8% |
| Immigrants | Uzbekistan | 61.6 /100 | #165 | Good 65.8% |
| Moroccans | 56.7 /100 | #166 | Average 65.6% |
| Immigrants | Somalia | 56.4 /100 | #167 | Average 65.6% |
| Hungarians | 55.9 /100 | #168 | Average 65.6% |
| Yugoslavians | 55.7 /100 | #169 | Average 65.6% |
| Germans | 55.7 /100 | #170 | Average 65.6% |
| Immigrants | Oceania | 55.0 /100 | #171 | Average 65.6% |
Demographics Similar to Greeks by College, Under 1 year
In terms of college, under 1 year, the demographic groups most similar to Greeks are Danish (68.5%, a difference of 0.010%), British (68.5%, a difference of 0.020%), Immigrants from Spain (68.4%, a difference of 0.030%), Immigrants from Western Europe (68.5%, a difference of 0.070%), and Laotian (68.5%, a difference of 0.070%).
| Demographics | Rating | Rank | College, Under 1 year |
| Bolivians | 99.0 /100 | #72 | Exceptional 68.7% |
| Immigrants | England | 99.0 /100 | #73 | Exceptional 68.7% |
| Swedes | 98.9 /100 | #74 | Exceptional 68.7% |
| Immigrants | Western Europe | 98.6 /100 | #75 | Exceptional 68.5% |
| Laotians | 98.6 /100 | #76 | Exceptional 68.5% |
| British | 98.6 /100 | #77 | Exceptional 68.5% |
| Danes | 98.6 /100 | #78 | Exceptional 68.5% |
| Greeks | 98.6 /100 | #79 | Exceptional 68.5% |
| Immigrants | Spain | 98.5 /100 | #80 | Exceptional 68.4% |
| Immigrants | Greece | 98.5 /100 | #81 | Exceptional 68.4% |
| Norwegians | 98.4 /100 | #82 | Exceptional 68.4% |
| Argentineans | 98.4 /100 | #83 | Exceptional 68.4% |
| Immigrants | Hungary | 98.3 /100 | #84 | Exceptional 68.3% |
| Egyptians | 98.3 /100 | #85 | Exceptional 68.3% |
| Immigrants | Lebanon | 98.3 /100 | #86 | Exceptional 68.3% |