Burmese vs Greek College, Under 1 year
COMPARE
Burmese
Greek
College, Under 1 year
College, Under 1 year Comparison
Burmese
Greeks
71.9%
COLLEGE, UNDER 1 YEAR
100.0/ 100
METRIC RATING
15th/ 347
METRIC RANK
68.5%
COLLEGE, UNDER 1 YEAR
98.6/ 100
METRIC RATING
79th/ 347
METRIC RANK
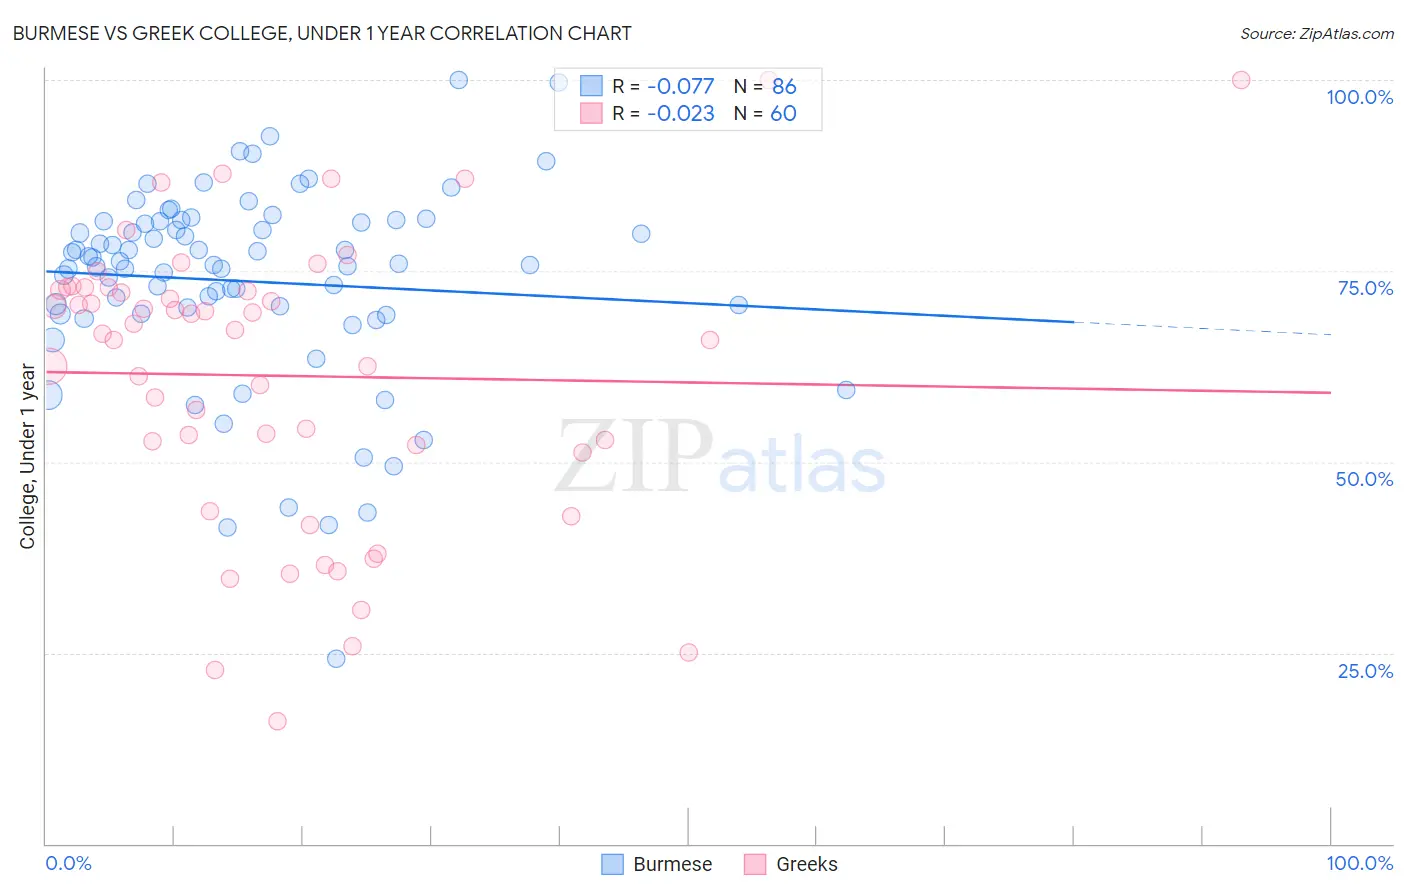
Burmese vs Greek College, Under 1 year Correlation Chart
The statistical analysis conducted on geographies consisting of 465,404,148 people shows a slight negative correlation between the proportion of Burmese and percentage of population with at least college, under 1 year education in the United States with a correlation coefficient (R) of -0.077 and weighted average of 71.9%. Similarly, the statistical analysis conducted on geographies consisting of 482,772,092 people shows no correlation between the proportion of Greeks and percentage of population with at least college, under 1 year education in the United States with a correlation coefficient (R) of -0.023 and weighted average of 68.5%, a difference of 5.0%.
College, Under 1 year Correlation Summary
| Measurement | Burmese | Greek |
| Minimum | 24.2% | 16.1% |
| Maximum | 100.0% | 100.0% |
| Range | 75.8% | 83.9% |
| Mean | 73.6% | 61.3% |
| Median | 75.9% | 67.1% |
| Interquartile 25% (IQ1) | 69.4% | 51.7% |
| Interquartile 75% (IQ3) | 81.5% | 72.6% |
| Interquartile Range (IQR) | 12.1% | 21.0% |
| Standard Deviation (Sample) | 13.1% | 18.9% |
| Standard Deviation (Population) | 13.0% | 18.8% |
Similar Demographics by College, Under 1 year
Demographics Similar to Burmese by College, Under 1 year
In terms of college, under 1 year, the demographic groups most similar to Burmese are Cambodian (71.9%, a difference of 0.0%), Immigrants from Japan (71.9%, a difference of 0.010%), Cypriot (72.0%, a difference of 0.12%), Eastern European (71.8%, a difference of 0.16%), and Immigrants from South Central Asia (72.1%, a difference of 0.28%).
| Demographics | Rating | Rank | College, Under 1 year |
| Thais | 100.0 /100 | #8 | Exceptional 73.4% |
| Immigrants | Australia | 100.0 /100 | #9 | Exceptional 72.7% |
| Immigrants | Israel | 100.0 /100 | #10 | Exceptional 72.3% |
| Immigrants | South Central Asia | 100.0 /100 | #11 | Exceptional 72.1% |
| Immigrants | Sweden | 100.0 /100 | #12 | Exceptional 72.1% |
| Cypriots | 100.0 /100 | #13 | Exceptional 72.0% |
| Cambodians | 100.0 /100 | #14 | Exceptional 71.9% |
| Burmese | 100.0 /100 | #15 | Exceptional 71.9% |
| Immigrants | Japan | 100.0 /100 | #16 | Exceptional 71.9% |
| Eastern Europeans | 100.0 /100 | #17 | Exceptional 71.8% |
| Immigrants | Switzerland | 100.0 /100 | #18 | Exceptional 71.7% |
| Latvians | 100.0 /100 | #19 | Exceptional 71.6% |
| Immigrants | Korea | 100.0 /100 | #20 | Exceptional 71.6% |
| Immigrants | Belgium | 100.0 /100 | #21 | Exceptional 71.5% |
| Immigrants | Eastern Asia | 100.0 /100 | #22 | Exceptional 71.3% |
Demographics Similar to Greeks by College, Under 1 year
In terms of college, under 1 year, the demographic groups most similar to Greeks are Danish (68.5%, a difference of 0.010%), British (68.5%, a difference of 0.020%), Immigrants from Spain (68.4%, a difference of 0.030%), Immigrants from Western Europe (68.5%, a difference of 0.070%), and Laotian (68.5%, a difference of 0.070%).
| Demographics | Rating | Rank | College, Under 1 year |
| Bolivians | 99.0 /100 | #72 | Exceptional 68.7% |
| Immigrants | England | 99.0 /100 | #73 | Exceptional 68.7% |
| Swedes | 98.9 /100 | #74 | Exceptional 68.7% |
| Immigrants | Western Europe | 98.6 /100 | #75 | Exceptional 68.5% |
| Laotians | 98.6 /100 | #76 | Exceptional 68.5% |
| British | 98.6 /100 | #77 | Exceptional 68.5% |
| Danes | 98.6 /100 | #78 | Exceptional 68.5% |
| Greeks | 98.6 /100 | #79 | Exceptional 68.5% |
| Immigrants | Spain | 98.5 /100 | #80 | Exceptional 68.4% |
| Immigrants | Greece | 98.5 /100 | #81 | Exceptional 68.4% |
| Norwegians | 98.4 /100 | #82 | Exceptional 68.4% |
| Argentineans | 98.4 /100 | #83 | Exceptional 68.4% |
| Immigrants | Hungary | 98.3 /100 | #84 | Exceptional 68.3% |
| Egyptians | 98.3 /100 | #85 | Exceptional 68.3% |
| Immigrants | Lebanon | 98.3 /100 | #86 | Exceptional 68.3% |